By: James Scott
“In the ledger of our future, climate change economics writes in red ink, a stark warning that profits today may spell bankruptcy tomorrow.“
Introduction
Climate Change Economics — Human civilization is facing possibly the greatest challenge in its recorded history over the next few decades: anthropogenic climate change. The Paris Climate Agreement and the recent COP26 Climate Conference have set ambitious goals for the reduction of anthropogenic greenhouse gas (GHG) emissions with the goal of reaching net-zero emissions by 2050 and limiting the global increase in temperatures to 1.5oC. To reach these goals, immediate and coordinated action is required. While new technologies are being developed to help reach these goals using renewable energy, carbon sequestration from the atmosphere, etc., there are technologies and solutions that can be deployed immediately to reduce GHG emissions. The most effective solutions are market-based solutions that can be implemented without a large permanent public investment. However, these solutions will probably need public-private partnerships to accelerate their adoption to meet the GHG emissions reduction goals.
Around 25% of global GHG emissions are produced by agricultural production, directly or indirectly. Therefore, any plan to reduce GHG emissions to net zero must include reducing agricultural emissions. Regenerative agriculture represents a set of practices that can minimize GHG emissions from agricultural productions, potentially creating negative emissions. This means that widespread adoption of these practices could reduce the overall global agricultural GHG emissions to zero or even make global agricultural production an effective mechanism to reduce global GHG emissions. Another important aspect of the adoption of regenerative agriculture practices is that this is economically viable – the initial investment required to make a switch to regenerative agriculture will pay off through the increased economic value of the agricultural production of regenerative farms. Considering that most methods for the reduction of GHG emissions require direct investment into emissions reduction without any long-term economic benefit other than climate change mitigation, it is clear why regenerative agriculture can be a powerful tool for combating climate change.
There is a complementary market mechanism that can be used to accelerate the adoption of methods for the reduction of GHG emissions – carbon markets. This is a market framework where carbon savings and negative emissions can be traded by entities that employ carbon sequestration methods to allow other companies to compensate for their own emissions while providing a financial stimulus for carbon sequestration and GHG emissions reduction. This also drives innovation because the development of better GHG emissions reduction methods can bring immediate economic benefits. These carbon markets have already been shown to provide an effective market-based mechanism for emissions reduction, and the main issue has been to expand them geographically, increase the supply of carbon credits, and provide a uniform framework for their operation.
Here we will provide an overview of the issues and opportunities pertaining to the adoption of regenerative agriculture and the development of local and regional carbon markets.
Climate Change as a Civilizational Challenge
It has been well established that climate change is primarily driven by anthropogenic greenhouse gas emissions – human activity is causing long-term detrimental climate trends that will be very difficult or impossible to reverse. Therefore, for the past few decades, there has been a concerted international effort to reduce global greenhouse gas emissions. However, these efforts have been largely ineffective.
After a decrease of around 5.4% in global greenhouse gas emissions in 2020, induced by lockdowns and interruptions in global trade and travel caused by the COVID-19 pandemic, the emissions bounced back in 2021 to values close to pre-pandemic levels (Global Carbon Budget, 2021). The decrease in 2020 was 1.9 GtCO2/yr, for a total of around 34.8 GtCO2/yr, comparable to the 2012 emissions level; however, the total emissions in 2021 were around 36.4 GtCO2/yr, compared to 36.7 GtCO2/yr in 2019. This can be attributed mostly to the increased demand for energy, with emissions from coal and gas increasing above 2019 levels (mainly caused by electricity production), while emissions from oil remained below their 2019 level due to lower demand for global transport and travel (Climate Change Economics).

On the national level, the increase is driven by the developing countries: emissions in China were higher by 5.5% compared to 2019 levels, reaching 11.1 GtCO2/yr; India exhibited 4.4% higher emissions, reaching 2.7 GtCO2/yr (Global Carbon Budget, 2021). On the other hand, the 2021 emissions in the United States (5.1 GtCO2/yr), the European Union (2.8 GtCO2/yr), and the rest of the world (14.8 GtCO2/yr in total) remain at 3.7%, 4.2%, and 4.2% lower than respective 2019 levels.
Table 1 shows the overview of national greenhouse gas emissions in tCO2/yr for 2016, both total and per capita. This shows that the top ten countries are responsible for around 70% of global emissions, even though their per capita emissions vary from around two tCO2/yr in India and Indonesia to 18.6 in Canada. This is mostly tied to their population and level of economic development. However, it is of note that the per capita emissions in China are comparable to those of developed EU countries and Japan, rather than developing countries like India and Brazil, which can be correlated with China’s continued dependence on energy from coal power plants. Even though China’s GDP per capita is only around a quarter of the EU average, its emissions per capita have reached the level of a typical EU country, which is indicative of extremely poor environmental practices and represents a long-term liability in the effort to mitigate climate change.
Table 1. Overview of global greenhouse gas emissions in tons of CO2 for the top 20 countries in 2016 (the full table of all countries is in the Appendix)
| Rank | Country | Emissions per capita | Total Emissions |
| 1 | China | 7.38 | 10432751400 |
| 2 | United States | 15.52 | 5011686600 |
| 3 | India | 1.91 | 2533638100 |
| 4 | Russia | 11.44 | 1661899300 |
| 5 | Japan | 9.7 | 1239592060 |
| 6 | Germany | 9.44 | 775752190 |
| 7 | Canada | 18.58 | 675918610 |
| 8 | Iran | 8.08 | 642560030 |
| 9 | South Korea | 11.85 | 604043830 |
| 10 | Indonesia | 2.03 | 530035650 |
| 11 | Saudi Arabia | 15.94 | 517079407 |
| 12 | Brazil | 2.25 | 462994920 |
| 13 | Mexico | 3.58 | 441412750 |
| 14 | Australia | 17.1 | 414988700 |
| 15 | South Africa | 6.95 | 390557850 |
| 16 | Turkey | 4.61 | 368122740 |
| 17 | United Kingdom | 5.55 | 367860350 |
| 18 | Italy | 5.9 | 358139550 |
| 19 | France | 5.13 | 331533320 |
| 20 | Poland | 7.81 | 296659670 |
Twenty-three countries decreased fossil CO2 emissions significantly from 2010-2019, and they contributed about 9.2 GtCO2 over this period, which is around one-quarter of world CO2 fossil emissions. Global CO2 emissions from land use, land use change, and forestry are estimated at 12-16 GtCO2/yr in the 2011-2020 period, and they are partly offset by carbon removals on managed land estimated at 8.5-11.5 GtCO2/yr. Therefore, the resulting net emissions in managed land are around 4 ± 3 GtCO2/yr. The decrease in 2020 compared to 2019 emissions has been in the range of statistical error, although there are indications of a further decrease in 2021 (Global Carbon Budget, 2021). However, there is high uncertainty in the data associated with land use change, which likely underestimates year-to-year variability and the importance of land degradation.
The carbon budget is an estimated total amount of global emissions that has a 50% likelihood to limit global warming to a particular level – levels usually considered are 1.5°C, 1.7°C, and 2°C increase in average global temperatures. At the start of 2022, the estimated remaining carbon budget has shrunk to 420, 770, and 1270 GtCO2, for a global temperature increase of 1.5°C, 1.7°C, and 2°C, respectively (Global Carbon Budget, 2021). This is equivalent to 11, 20, and 32 years of emissions at the 2021 level, respectively. Total anthropogenic emissions were 38.0 GtCO2/yr in 2020 and 39.4 GtCO2/yr in 2021. To reach net zero emissions by 2050, we must cut about 1.4 GtCO2 per year on average, which is the difference between 2020 and 2021 emissions. This highlights the magnitude of the task at hand and the urgency of immediate action.
The concentration of atmospheric CO2 reached 414.7 ppm at the end of 2021, even though the reduction of CO2 emission in 2020 slowed down the rate of increase of the atmospheric CO2 concentration by about 0.18 ppm (Global Carbon Budget, 2021). The atmospheric CO2 growth amounted to around 47% of total CO2 emissions during the last decade, with the rest absorbed by CO2 sinks (land absorbs around 28% and ocean around 25% of total emissions). The ocean CO2 sink resumed a more rapid growth in the past decade after low or no growth during the 1991-2002 period. However, the estimates of the size of land and ocean carbon sink have high levels of uncertainty and wide margins of error. The ocean CO2 sink is estimated at around 10.7 ± 1.5 GtCO2/yr, and its size has been stable over the past decade. The land CO2 sink exhibited a continuous increase during the past decade and reached 12 ± 2 GtCO2/yr, which is an increase of 21% compared to the previous decade. The annual variability of the land carbon sink is around 4 GtCO2/yr, more than 30% of the total size of the land carbon sink, which makes it harder to detect annual changes in the atmospheric CO2 caused by human activity.
Cumulative anthropogenic CO2 emissions over the past 170 years amount to over 2400 GtCO2: more than 2/3 of this can be attributed to human activities over the last 60 years and 30% to human activities over the last 20 years (Global Carbon Budget, 2021). Total yearly emissions increased more than 100% over the past 60 years, and 30% of total historical emissions have come from land use, while 70% came from fossil fuels. However, over the past century, fossil fuel usage has been primarily responsible for the increase in carbon emissions, which is reflected in the rising contribution of fossil fuels to emissions in recent times: only 10% of carbon emissions over the past decade originated from land use.
It is important to note that land use is just one component in agricultural fossil fuel emissions, contributing around 40% to agricultural emissions. The rest comes from the use of machinery, which consumes fossil fuels, and chemicals, which are synthesized from fossil fuels, and transport. The advantage of regenerative agriculture, with respect to carbon emissions, is that it reduces emissions across the board: reducing the need for the use of chemicals and related transport while also reducing or reversing emissions from land use. Regenerative agriculture practices have the side-effect of localizing the supply chain and reducing the off-farm inputs, which represent the main source of carbon emissions in agricultural production.
Climate Change Economics as a National Security Issue
The role of climate change in national security has been a focus of much discussion. There are numerous examples of the effects of climate change on geopolitical situations at local, regional, and global levels. Russia has been looking to exploit the natural resources in the Arctic that have become accessible by the melting of the ice due to global warming, while the US and China are facing the threat of rising sea levels on the coastal communities: China has over 120,000 square kilometers of coastal areas at or below 10 meters above sea levels, while the coast of Florida is threatened by saltwater incursion. In addition to direct effects, there are potential indirect effects, like mass migrations from undeveloped or developing countries that are particularly affected by climate change, with the associated security risks. Therefore, environmental security has become a permanent fixture in the national security strategies of all major countries over the past 20 years. All of these agree that it is necessary to mitigate the effects of climate change, as these represent a major threat to national security.
In 2003, a report commissioned by the Pentagon, “An Abrupt Climate Change Scenario and its Implications for United States National Security” (FEMA, 2003), envisioned a worst-case scenario of the climate change effects. It predicted catastrophic consequences of climate change, like rioting and nuclear war, which is now obviously deemed an exaggeration of the potential consequences. But this highlights the difficulties with predicting societal changes caused by global warming: climate change is a gradual process that plays out over a very long time – several decades. However, it is also extremely hard to stop once it gets going, so the climate change effects caused by global warming also persist over a long period. This makes societal effects hard to predict because climate change creates persistent pressure on society rather than a single catastrophic event. Furthermore, the intensity of this pressure can change suddenly at critical points – for instance, a sudden reduction in the capacity of the ocean carbon sink due to a critical increase in global ocean temperature would release a large quantity of CO2 into the atmosphere, increasing the prospect of extreme weather events, or accelerating the pace of global warming. Our current ability to predict such critical points and their consequences are relatively limited.
The second problem with the societal effects of climate change is that global warming is slow because it requires massive energy to produce. However, the same is true for reversing it: once climate changes due to global warming, it will take significant time and effort to reverse those changes, if that is even possible. Although we consider humans to be exceptionally adaptable, the same is not true for large human populations: human civilization developed over the last 6000 years in relatively stable climate conditions. There were some temporary climate changes, like the Little Ice Age, that lasted from the mid-15th century to the mid-19th century in the Northern hemisphere, but those changes in temperature have been lower than even the current increase in temperature – a maximum of 0.6°C. Even these changes in temperature caused widespread hardship and regular famines – in the late 17th century, famines wiped out 20-30% of the population of countries like France, Sweden, Germany, the Netherlands, and Finland.
Therefore, there is no historical precedent for climate change effects of this magnitude (1.5 – 2°C) on human civilization or societies, although these effects have been universally bad, especially regarding agriculture and food security. An increase in global temperature generally causes local droughts and floods due to the faster melting of snow and potentially more rainfall in the spring. How individual countries deal with these varies significantly and is based on several factors, including economic development, effective political institutions, and cultural traditions.
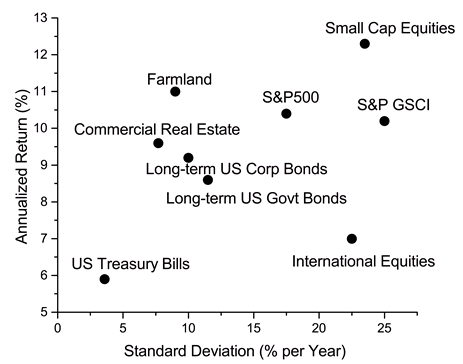
Figure 1. Shows the changes in nominal and real food prices over the past 60 years. Until the late 1980s, the world benefited from falling food prices. However, after a period of relatively stable prices, food prices have been rising since 2007. This created significant economic pressure on developing countries and contributed to economic and social instability in volatile regions across the world. While it is too early to correlate the rising food prices with the effects of climate change, the period of rising food prices corresponds to the period of record global temperatures in the past 150 years.
Going one step further, the societal effects of climate change can have extreme consequences: civil wars, political and religious violence, and regional conflict. However, predicting these is extremely hard, and political and social scientists have generally drawn connections to climate change after these events have already occurred. Frances Adamson, Secretary of the Department of Foreign Affairs and Trade (DFAT) of Australia, 2018 Sir John Crawford Memorial Address:
“In 2017, 15% of global grains were exported, many feeding into value chains around the world. Compare this with oil, where 9% of production was exported in 1965 and 71% in 2016. In 2016, around 815 million people – close to 10% of the global population – were considered undernourished. Sadly, the impacts of chronic hunger and malnourishment are always the most severe on children. Globally, of the 667 million children aged five or under, almost a quarter (22.9%) are considered to have had their growth stunted.”
All nations and all national governments are sensitive to the importance of their capacity to ensure reliability in the food supply, but it is a particularly important issue for developing countries – especially those whose geography, history, or natural endowments do not lend themselves to reaching long-term food security goals. In 1996, the Chinese Central Government produced a White Paper on ‘The Grain Issue in China,’ which identified national food security, particularly in grains, as a high-order priority. Still today, in the many iterations of the Communist Party’s No. 1 Central Policy Document, questions of agricultural and rural development remain front and center. ‘Ensuring long-term food supply […] is a necessary and basic policy for governing the country.’
We see a similar story today in Syria – a country that has seen dramatic changes to its rainfall patterns since the 1990s. With these critical water security issues came a decline across rural farming communities – simply put, traditional income streams were not as reliable as they once were. The domino effect again – we saw Syrians forced out of their livelihoods and moving to major urban centers. We saw more urban poverty as a result, greatly compounding the impact of other political and social issues that sparked protests and escalating violent responses. Today, we see those changing rainfall patterns for what they really represented to the people of Syria – fueling the disintegration of internal social and political cohesion. The conflict has, in turn, devastated already declining agricultural productivity and has all but destroyed the food security landscape for the local population.” (Sir John Crawford Memorial Address, 2018)
In addition, people have been looking at possible correlations between mass migrations with climate change. Historically, when faced with extreme poverty and a shortage of resources, including food, people tend to move to other regions, and modern globalization processes have made it easier to move across large distances. In recent years, we have seen mass economic migrations from North Africa, the Middle East, and South Asia which have created significant social tensions in the European Union. However, no causal link has been established between climate change and local and regional conflicts, while globalized trade and supply chains have reduced the need for national resources to provide for sustained economic growth and development.
However, climate change can produce stress that can exacerbate existing local or regional tensions, destabilizing a region and creating favorable conditions for conflict. This makes climate change a vital national security issue for any major nation, especially the United States, making it imperative to address it by mitigating its long-term effects.
Climate Change Policies and Goals
Under the Kyoto Protocol, 192 countries committed to the reduction of greenhouse emissions. Signed in 1997, the Protocol came into force in 2005, although Canada withdrew in 2012, and the United States never ratified it. During the first commitment period, 2008-2012, 36 countries participated to reduce their greenhouse gas emissions, with mixed success, while 37 countries (34 ratified) entered the second commitment period (2012-2020) with additional targets.
In 2015, the Paris Agreement was agreed upon by 196 countries, with a goal to keep the overall global temperature change below 2°C and preferably to 1.5°C. The emissions are to be reduced as quickly as possible, and net-zero emissions should be achieved by 2050. However, the current national targets set under the Paris Agreement would be insufficient to reach these stated goals, while enforcement mechanisms are weak or non-existent.
The COP26 conference in Glasgow in 2021 brought new pledges from developed countries that would, according to the experts, put the world on a path to a 1.8°C to 2.4°C increase in global temperatures. There is also a stated commitment to revisit these commitments to further reduce the projected increase in global temperatures to 1.5°C, reaching the maximum ambition set out by the Paris Agreement.
COP26 also completed the technical negotiations on the so-called Paris Agreement Rulebook, which fixes the transparency and reporting requirements for all Parties to track progress against their emission reduction targets. The Rulebook also includes the Article 6 mechanisms, which set out the functioning of international carbon markets to support further global cooperation on emission reductions.
On climate finance, the agreed text commits developed countries to double the collective share of adaptation finance within the $100 billion annual targets for 2021-2025 and to reach the $100 billion goal as soon as possible. Parties also commit to a process to agree on long-term climate finance beyond 2025. The COP also decided to establish a dialogue between parties, stakeholders, and relevant organizations to support efforts to avert, minimize and address loss and damage associated with climate change.” (EU, 2021)
On 1-2 November, President Ursula von der Leyen represented the Commission at the World Leaders Summit, which opened COP26. The President pledged €1 billion in funding for the Global Forests Finance Pledge on 1 November. On 2 November, the EU announced a Just Energy Transition Partnership with South Africa and officially launched the Global Methane Pledge, a joint EU-US initiative that has mobilized over 100 countries to cut their collective methane emissions by at least 30% by 2030, compared to 2020 levels. President von der Leyen also kicked off the EU-Catalyst partnership with Bill Gates and EIB President Werner Hoyer.
From 7 to 13 November, Executive Vice-President Frans Timmermans led the EU negotiating team in Glasgow. On 9 November, Mr. Timmermans announced a new pledge of €100 million in finance for the Climate Adaptation Fund, by far the biggest pledge for the Adaptation Fund made by donors at COP26. It comes on top of significant contributions already announced by the Member States and also confirms the EU’s supporting role to the informal Champions Group on Adaptation Finance.” (EU, 2021)
COP26 Goals (COP 26 The Glasgow Climate Pact, 2021):
- Mitigation – reducing emissions
- Adaptation – helping those already impacted by climate change
- Finance – enabling countries to deliver on their climate goals
- Collaboration – working together to deliver even greater action
1. Mitigation: secured near-global net zero NDCs from 153 countries and future strengthening of mitigation measures. Over 90% of the world GDP is now covered by net-zero commitments. All 153 countries put forward new 2030 emissions targets (NDCs). The Glasgow Climate Pact accelerates the drumbeat and puts in place the underpinning rules and systems. In Glasgow, countries agreed to come back next year with new strengthened commitments and a new UN climate program on mitigation ambition, and they finalized the Paris Rulebook. To deliver on these stretching targets, the Presidency has driven commitments to move away from coal power, halt, and reverse deforestation, reduce methane emissions, and speed up the switch to electric vehicles.
2. Adaptation & Loss and Damage: 80 countries are now covered by either Adaptation Communications or National Adaptation Plans to increase preparedness for climate risks, with 45 submitted over the last year. The Glasgow – Sharm el-Sheikh Work Programme on the Global Goals on Adaptation was agreed upon, which will drive adaptation action. Record amounts of adaptation finance have been pledged, including committing to doubling 2019 levels of adaptation finance by 2025. This is the first time an adaptation-specific financing goal has ever been agreed upon globally. Nations have announced new partnerships to improve access to finance, including for Indigenous Peoples. A new Glasgow Dialogue on Loss and Damage funding arrangements was created. The Santiago Network on Loss and Damage was brought to life through clear functions and funding.
3. Finance: Developed countries have made progress towards delivering the $100 billion climate finance goal and will reach it by 2023 at the latest. 34 countries and five public financial institutions will stop international support for the unabated fossil fuel energy sector next year. Private financial institutions and central banks are moving to realign trillions toward global net zero. In Glasgow, countries agreed on the way forward for the new post-2025 climate finance goal. Developed countries committed significantly increased funding to vital funds such as the Least Developed Countries Fund.
4. Collaboration: The Glasgow Breakthroughs will accelerate collaboration between governments, businesses, and civil society to deliver on climate goals faster, whilst collaborative councils and dialogues in energy, electric vehicles, shipping, and commodities will help deliver on commitments. At COP26, we finalized the Paris Rulebook – agreeing on the ‘enhanced transparency framework’ (common reporting of emissions and support), a new mechanism and standards for international carbon markets, and common timeframes for emissions reduction targets.” (COP 26 The Glasgow Climate Pact, 2021)
While these pledges are commendable, it is worth noting that the historical record of action following global climate conferences has been abysmal. None of the emission reduction targets set by previous climate protocols after the conferences in Kyoto in 1997 and in Paris in 2015 have been completely met, given the timeline of emission reduction established by these international agreements. In addition, the application of mechanisms for the reduction of greenhouse gas emissions has been slow, and compliance mechanisms are significantly weaker than the comparable national laws in signatory countries. The nominal overall success of the Kyoto Protocol can be attributed almost entirely to the deindustrialization of the former Eastern Bloc countries, which led to significant decreases in greenhouse gas emissions compared to 1990 levels (typically 50-60%), far exceeding their Kyoto Protocol targets. This compensated for the non-compliance of most of the developed countries. However, the Kyoto Protocol targets are deemed insufficient today, and large economies like China and India were not obligated to reduce emissions. The US never ratified the agreement, and Canada withdrew, leaving 36 countries in the protocol. This led to an overall increase in global emissions by 32% from 1990 to 2010, even though 36 Kyoto countries reduced their overall emissions by around 24% by 2010 compared to 1990 levels.
The financial pledges have also failed to materialize in the past: at the UN Climate Summit in Copenhagen in 2009, developed nations pledged $100 billion a year to the developing and undeveloped nations by 2020 to help them adapt to climate change and mitigate its effects. Although the $100 billion annual figure is relatively small compared to the effort required to meet the targets set out in the Paris Agreement, it has not been met in any of the past 12 years, reaching around $80 billion in 2020, with an average commitment of less than $60 billion over the past seven years. And charities like Oxfam have been critical of these figures, claiming that the real value of this aid has been much lower because most of it comes in the form of loans and not grants (Nature, 2021). It remains to be seen whether the pledges from the COP26 conference will be met or will share the fate of the previous financial pledges.
Therefore, the new climate goals require immediate and decisive action, especially by the largest economies, as history has shown that partial solutions and commitments cannot produce long-term sustainable results.
Regenerative Agriculture
Regenerative Agriculture as a Tool for Combating Climate Change
Although there is no universally agreed-upon definition of regenerative agriculture, it is generally accepted that it promotes self-renewal and resiliency, contributes to soil health, increases water percolation and retention, enhances, and conserves biodiversity, and sequesters carbon (Elevitch, 2018). There are also some basic principles of regenerative agriculture, which are widely understood to include:
1) maintaining (to the degree possible) continuous vegetation cover on the soil, 2) reducing soil disturbance, 3) increasing the amount and diversity of organic residues returned to the soil and 4) maximizing nutrient and water use efficiency by plants” (Paustian, 2020).
It is estimated that soil carbon sequestration “has the potential to offset fossil-fuel emissions by 1.5 to 4.4 GtCO2/yr, or 5 to 15% of the global emissions” (Lal, 2004a) and provide enhanced food security. This is particularly true of undeveloped countries and regions where agricultural production has not seen significant yield increases over the past 50 years. Therefore, the climate mitigation potential of using regenerative agriculture practices has been shown to be significant (Paustian, 2020; Gosnell, 2020).
Regenerative agriculture can help mitigate climate change in two principal ways: by reducing the greenhouse gas emission of agricultural production and through increased soil carbon sequestration. Compared to industrial agriculture, regenerative agriculture can significantly reduce the emission of greenhouse gasses, both direct and indirect. In addition, the reclamation of devastated land and better soil management of existing agricultural land provide additional carbon sequestration from the atmosphere, reducing the concentration of greenhouse gasses. Finally, better land management ensures that carbon emissions from the soil are reduced because of the prevention of erosion and reduced tillage.
There are several ways regenerative agriculture can be used to minimize the greenhouse gas emission of agricultural production (Gosnell, 2020):
- Reducing or eliminating fossil-fuel-derived inputs (like synthetic fertilizers, pesticides, and herbicides) (Picasso, 2014; Rotz, 2019)
- Reduced use of farming machinery and use of renewable energy sources (Lal, 2004b)
- Reduced need for off-farm inputs (Herrero, 2013; Dudley, 2014)
This reduces both the direct emission of greenhouse gasses through lower fuel and fossil-fuel energy consumption and the indirect emissions derived from the production of off-farm inputs like fertilizers and pesticides. It has been estimated that the net carbon footprint when utilizing regenerative agriculture methods is -628 to -3545 kg CO2-eq ha-1, compared to +488 kg CO2-eq ha-1 of conventional farming methods (He, 2019). This means that a switch from conventional to regenerative farming could effectively reduce emissions by 1.1 to 4 tons of CO2 equivalent per hectare annually.
Regenerative agriculture can also enhance the effectiveness and capacity of natural carbon sinks by reducing bare ground and soil erosion, planting perennial species, which develop larger and deeper root systems, and increasing plant productivity and microbial biomass (Xu, 2018; Henneman, 2014; McDermot, 2014; Badgery, 2014). Soil erosion has been estimated to be a significant contributor to anthropogenic greenhouse gas emissions, and regenerative agriculture methods can almost eliminate soil erosion while increasing soil carbon content (Teague, 2016). Healthier soil exhibits improved water retention, lowering water consumption of regenerative production. This has the side benefit of enhancing the resilience of regenerative fields to droughts and other natural disasters, reducing damage from them, and allowing regenerative fields to recover faster after adverse events (Bennett, 2021).
Soil as a Carbon Sink
Soil organic carbon (SOC) plays a vital role in soil productivity and represents a major factor in the environmental health of agricultural land. Soil organic matter (SOM) is the main source of nutrition for plants in agricultural production, making it vital for food and fiber production (Goh, 2004). However, it is also a major reservoir of greenhouse gasses (GHG) and carbon dioxide (CO2), allowing it to be utilized as a carbon sink with proper land management, or it can represent a net source of GHGs if the land is not managed with this in mind. Therefore, soil can be utilized for carbon sequestration and storage by increasing the SOM through regenerative agriculture practices, which represents a significant tool for reducing GHGs in the atmosphere to mitigate predicted climate changes. The potential for carbon sequestration in the soil is the greatest for agricultural and degraded soil, where significant increases in SOM can be achieved. However, healthy soils also need to be managed with care, as their degradation can release significant amounts of GHGs already stored in them. This also means that the GHGs sequestered in the soil always have the potential of being released back into the atmosphere to some degree, making the correct evaluation of carbon sequestration in the soil a complex process that requires long-term monitoring. Since healthy soil already contains a significant amount of SOM, much closer to the upper limit of SOM content, its potential for carbon sequestration is significantly lower than that of devastated land or agricultural land used for conventional agriculture.
This makes the regeneration of devastated land the most effective tool for carbon sequestration and climate change mitigation, while proper management of healthy soil is required to make carbon sequestration permanent. Soil regeneration of devastated land also has the added benefit of increasing the available agricultural land and increasing the value of the regenerated land. However, this process may be slow, requiring a century or longer to re-attain pre-agricultural soil carbon levels. There are methods that can accelerate the soil regeneration process and increase the annual rate of carbon sequestration. One of these methods is the restoration of late-successional grassland plant diversity, where annual carbon storage rates are increased by 200% by the second period (years 13–22) and are 70% greater than in monoculture agricultural land (Yang, 2019).
“The higher soil carbon storage rates of the second period (years 13–22) are associated with the greater aboveground production and root biomass of this period, and with the presence of multiple species, especially C4 grasses and legumes. Our results suggest that restoration of high plant diversity may greatly increase carbon capture and storage rates on degraded and abandoned agricultural lands. When compared with natural succession at our site, the high rates of soil carbon accumulation observed in our restored high-diversity grassland ecosystems suggest that immediately restoring degraded land to a high diversity of the dominant late-successional perennials may notably increase the ability of these lands to contribute to climate change mitigation via C sequestration. High-diversity restorations on abandoned and degraded lands may provide other environmental benefits, including reduced nitrate leaching, reduced year-to-year variability in biomass harvests, fewer invasive plant species, and lower soil N2O emissions. Restorations also provide habitat that might help lower extinction risks. Another climate moderation benefit could occur if aboveground biomass from degraded and abandoned agricultural lands were harvested for bioenergy production. In total, the restoration of high-diversity ecosystems on degraded and abandoned lands merits further consideration for its potential to provide multiple ecological and environmental benefits, including increased carbon capture and sequestration.” (Yang, 2019)
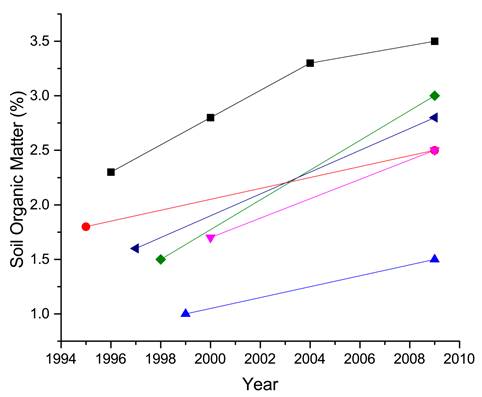
Another aspect of using regenerative agriculture as a tool for climate change mitigation is the uncertainty regarding the exact potential capacity of agricultural land as a carbon sink. Figure 2. shows the observed change in soil organic matter (SOM) in organic farms in France because of a switch from conventional tillage to minimal tillage. While the change in tillage practice resulted in an increase in SOM in all the observed farms, the change in SOM varied from farm to farm, and the rate of change was not dependent on the initial SOM content. This highlights two main points about the use of regenerative agriculture for carbon sequestration: there is definite long-term potential to use agricultural land as a carbon sink; there is the inherent difficulty of extrapolating local or regional performance of farms as carbon sinks to a broader national or global level.
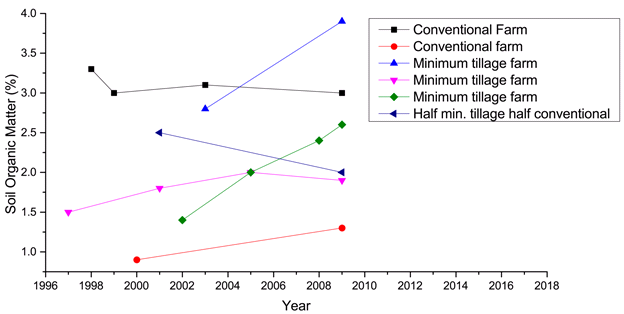
Figure 3. compares the change in SOM content after different levels of implementation of no-tillage practices and compares these to the performance of conventional farms. The survey data show clearly that a variation in the level of organic matter in the soils can be recorded. This depends directly on the intensity of soil tillage and the annual cover rate with major recycling of biomass. All results with increasing organic matter levels, therefore, come from techniques copying the functioning of the ecosystem as far as possible: no-till or little soil tillage, permanent cover, and optimized biomass recycling. Minimum tillage farms perform the best on average in increasing the SOM content and consequently would provide the highest carbon sequestration rate when it comes to permanent carbon sequestration in the soil. Conventional farming has minimal capacity to contribute to carbon sequestration in the soil in the long term.
Although the SOM level is a good indicator, it is difficult to make meaningful annual measurements due to normal annual variations and the effects of external factors like weather, natural disasters, etc. These introduce a natural variability of annual values that requires SOM levels to be monitored and observed over longer multi-year periods. This makes it difficult to use soil analyses to accurately measure agricultural carbon sinks. However, other measurements, like the annual humus rate, can be used to improve the accuracy of the SOM level indicator. Humus rate can significantly simplify the estimation of carbon sequestration in the soil: a positive rate indicates carbon storage, and a negative one indicates CO2 emission. This can be used as a short-term indicator of whether agricultural land acts as a carbon sink, while the long-term effects can be measured using SOM levels.
The carbon sequestration measurements have been shown to vary a lot on an annual basis. The best sequestration figures measured during a study in France were about 2 t of carbon per ha per year (7.4 tCO2/yr) when livestock farm GHG emissions were very low. The overall carbon sequestration potential in France can be extrapolated using these figures: using an average of 1 t of carbon per hectare and emission (CITEPA, 2022).
Using a similar methodology, the global sequestration potential of agricultural soils can be estimated on an annual basis and typically range from 0.4 to 1.2 gigatons of carbon per year (GtC/yr) or 1.5-4.4 GtCO2/yr (Lal, 2004a). Some estimates are more optimistic, including Kell (Kell, 2011; Kell, 2012), who claims that the improvement in root growth in agricultural crops can result in soil carbon storage that matches anthropogenic emissions until 2050. When extended across a timeline of a few decades, the uncertainty of carbon sequestration rates produces vastly different estimates of the total potential of soil carbon sequestration to mitigate climate change economics. Optimistically, the annual carbon sequestration rates in soil could account for at least 10% of the current annual emissions of 8-10 Gt/yr (Hansen, 2013), while a more pessimistic estimate would result in soil carbon sequestration accounting for less than 5%. If deep-rooted crops could be elevated and bred, that potential might be even greater (Kane, 2015).
 |
 |
 |
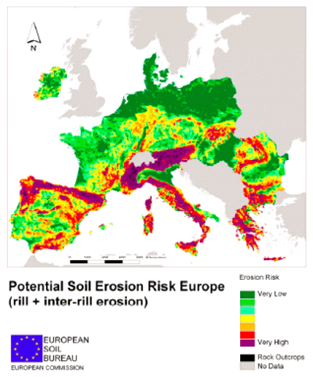 |
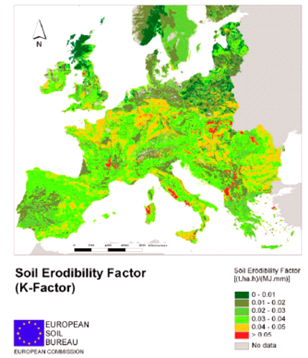
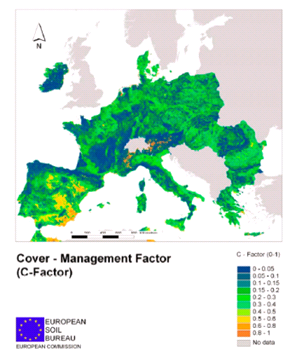
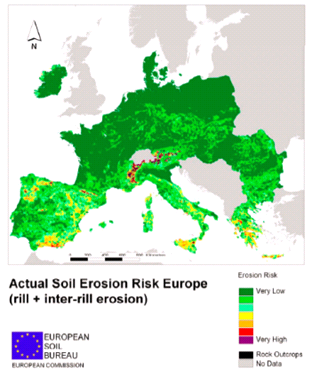
One of the benefits of regenerative agriculture is the improved quality of the soil, which significantly reduces soil erosion and mitigates soil erosion risk. Soil erosion also represents a mechanism of releasing GHG from the soil in addition to causing the loss of arable land. Figure 4. shows the actual and potential soil risk erosion in Europe, considering the future effects of climate change. This shows that most of Southern and South-Eastern Europe could experience significant erosion because of climate change, land mismanagement, and reduction in the amount of plant cover. This would seriously affect the quality and quantity of agricultural land in these regions, reducing the carbon sink potential of this land and causing significant GHG emissions as a result. This indicates that deploying regenerative agriculture solutions in these regions would provide multiple additional benefits beyond the typical effects on the quality of agricultural products and carbon sequestration in the soil. It would also serve to protect these regions from land erosion risk caused by climate change, potentially expand the usable arable land area, and improve biodiversity instead of the loss caused by soil erosion.
Economics of Regenerative Agriculture
The economics of agriculture consists of several factors: the agricultural land itself, which holds value on its own, farm income, and farm expense. Regenerative agriculture practices can be shown to improve the risk-benefit profile in all these factors. Creating healthy soil and using environmentally friendly agricultural practices inherently increases the value of agricultural land, regardless of any other factors that would affect its value. Regenerative agriculture practices also reduce off-farm inputs like chemicals, reducing annual operational costs. Finally, regenerative agriculture creates better quality products, which have higher market prices, which boosts income. Now, we will look at all these three components of farm value in more detail to examine the economic benefits of regenerative agriculture.
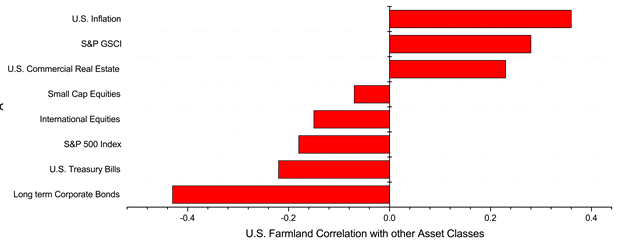
Figure 5. shows the correlation between investment returns of US farmland and some other asset classes over the last 50 years. This shows that the US farmland has been one of the more profitable investments in the last several decades, outperforming S&P 500 index and US Treasury Bills, which are standard investment benchmarks. This return on investment only considers the appreciation in the value of the agricultural land, without the added benefits of agricultural production. This is not surprising, considering that agricultural land is a limited commodity, which is expected to continuously appreciate as its supply diminishes over time because of urban development and industrialization.
Figure 6. shows annualized historical returns of different types of investments, including farmland. Higher annualized return is better, while standard deviation represents a measure of risk – how much specific year-to-year returns deviated from the overall average. We can see that US farmland represents high-yield and low-risk investments, beating even long-term US government bonds on both risks and return. This makes US farmland historically one of the best investment opportunities in the financial market.
All of this shows that agricultural land represents a good long-term investment that produces a steady increase in value. However, it is important to note that while the value of land increases, it does not produce on its own any additional free capital that could cover unexpected expenses.
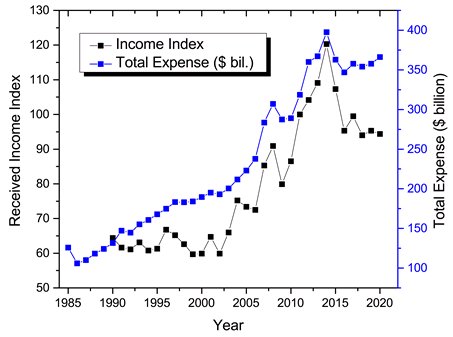
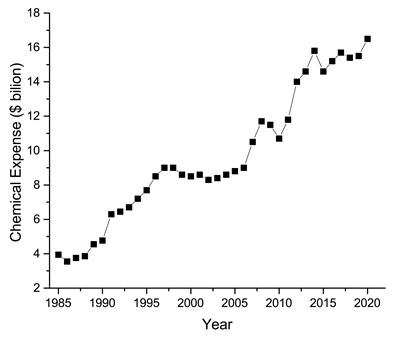
Figures 7. and 8. show historical changes in farm expenses and the total farm income index. The expenses have increased almost continuously since 2007, and two major increases in expenses can be correlated with the price of oil, which is used as both fuel on the farm and as a resource in the chemical industry to produce various chemical products used on a farm. A look at the income index shows that it has not kept pace with the costs in the past five years.
Figure 9 shows historical farm income against the consumer price index (CPI). Again, it is obvious that the farm income has not been able to keep pace with the CPI in the past several years, affecting the profitability and economic viability of farms.
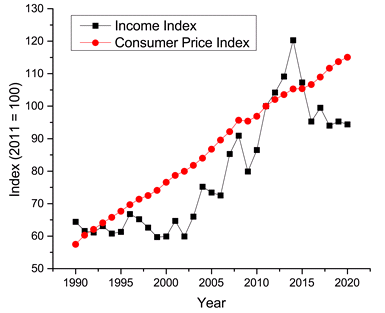
Figure 10. shows historical price indexes for key off-farm inputs in conventional agriculture against the farm income index. We can see that the prices of fuel and fertilizer have shown significant volatility in the 2000s, and this is bound to be the case in the future, given the cartel structure of international oil production. Another significant expense in conventional agriculture has been the seeds: while the farm income index doubled since the 1980s, the seed price index more than tripled in the same period. This is where regenerative agriculture truly shines: it moves away from monoculture agriculture, providing a variety of crops, which reduces the need for outside seeds and increases farm resilience to market shock.
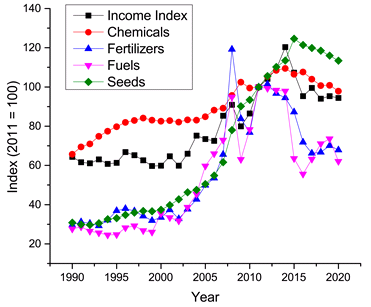
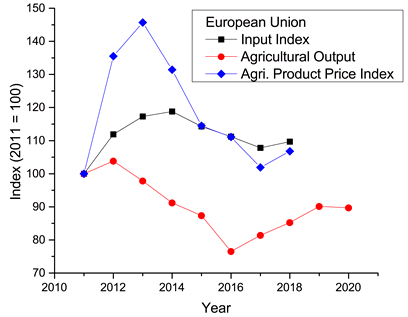
Figure 11. shows the agricultural input and output indexes, as well as the agricultural product price index in European Union in the 2010s. This shows that the value of agricultural output reduced in correlation with an increased cost of agricultural inputs even in times of relatively high agricultural product prices. This shows the extremely low economic resilience of EU agriculture and a need for a transition to methods that provide increased resilience and higher quality outputs.
The information above shows that while agricultural land represents a solid long-term investment, conventional agricultural production has significant risk factors, especially regarding different trends of farm income and the price of agricultural products on the one hand and the farm operating costs, especially fuel, chemicals, and seeds, on the other. Market volatility requires modern farms to be as resilient as possible to market shock and economic factors. Regenerative agriculture provides a way to accomplish this in an environmentally friendly way: by cutting off-farm expenses and increasing the value of the agricultural products and the land itself through the increase in quality.
Yield Gap Between Organic and Conventional Agriculture: Is Regenerative Agriculture the Answer?
A global meta-analysis of yields and yield stability in organic and conservation agriculture shows that the temporal yield stability of organic and conventional farms is very similar, indicating that the application of organic farming practices does not have long-term detrimental effects (Knapp, 2018). However, the average yield of organic and conservation farms was around 15% lower on average (2-30% lower) compared to the conventional farms. It is important to note that the practices on observed organic farms did not include the use of cover crops, which the authors note could help close the yield gap between organic and conventional farms. Notably, regenerative agriculture almost universally includes the use of cover crops, both for soil protection and for natural fertilization (“green manure”). In addition, the observed time window (4 years) was not wide enough to observe the effects of environmental stresses like droughts or climate change effects.
Absolute and relative yield stability, on average, showed no difference between no-tillage and conventional tillage farms. However, yield and yield stability were affected by climate, where no-tillage farms had a reduced yield and yield stability in a humid climate compared to their dry climate counterparts. This indicates that no-tillage is more effective in climate conditions that can dry out the soil by preserving humidity within. These differences are probably due to better soil water retention and slightly higher yields of no-tilled soils in dry climates vs. the negative effects of delayed soil warming, nutrient mineralization, and reduced soil aeration in no-tilled, wet, and heavy soils (Martínez, 2016). Selection and breeding of crop varieties for conservation agriculture are not yet widespread, and crops used are typically optimized for monoculture conventional farming (Newton, 2012). Hence, breeding efforts aimed at producing crops specifically for conservation farming may enhance yield and yield stability in regenerative agriculture.
Another recent study compared organic and conventional farming over a much longer period, analyzing results from an experiment started under identical soil conditions comparing one organic and two conventional farming systems (Schrama, 2018). The study shows that organic and conventional farms produce similar yields in the long run, even though organic farms produce lower initial yields. However: “organic farming resulted in a lower coefficient of variation, indicating enhanced spatial stability, of pH, nutrient mineralization, nutrient availability, and abundance of soil biota. Organic farming also resulted in improved soil structure with higher organic matter concentrations and higher soil aggregation, a profound reduction in groundwater nitrate concentrations, and fewer plant-parasitic nematodes. Temporal stability between the three farming systems was similar, but when excluding years of Phytophthora outbreaks in potatoes, temporal stability was higher in the organic farming system.” (Schrama, 2018) The conclusion is that the closure of the yield gap between organic and conventional farming can be a matter of time and that organic farming may result in greater spatial stability of soil biotic and abiotic properties and soil processes. This is likely due to the time required to fundamentally alter soil properties through regenerative practices.
A recent study of the use of “green manure” in the form of cover crops has shown that “cover crop effects on crop yield were highest in the organic system with reduced-tillage (+24%), intermediate in the organic system with tillage (+13%) and in the conventional system with no-tillage (+8%) and lowest in the conventional system with tillage (+2%).” (Wittwer, 2017) This shows that the use of cover crops for the fertilization of the soil should be able to significantly reduce the yield gap between conventional and organic farming: in this study, the gap was reduced from around 37% to 19%. Considering that the yield benefits are largest in no-tillage organic farms, this also emphasizes the benefits of regenerative agriculture, which falls under this category.
Regenerative agriculture also largely addresses the other major source of the yield gap between organic and conventional agriculture: enhanced disease pressure. Since organic agriculture does not use chemical pesticides, there is a reduced ability to quickly control the pest population. However, organic agriculture applies alternative means to pest control, which provides both pest control and enhanced pest resistance, making it more effective than traditional organic farming practices. In addition, past and current breeding programs have largely focused on high-yielding varieties adapted to work well with conventional inputs, and there has been little selection for traits being important in organic agriculture (e.g., increased disease resistance, enhanced cooperation with plant symbionts, better weed-suppressing abilities or higher resistance and competitive ability against weeds).
Maximizing Nutritional Value of Modern Agricultural Products
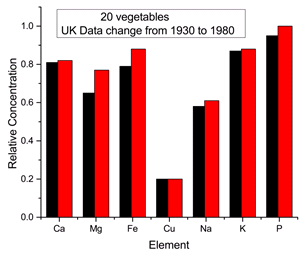
Comparison of the nutritional content of different varieties of the same crop grown side-by-side or of archived samples of grain have shown that modern crops exhibit higher yields primarily through the accumulation of carbohydrates (starch, sugar, and/or fiber) without an accompanying increase in the content of some other nutrients. This creates a dilution effect of vital nutrients in modern agricultural products and, consequently, modern diets (Figure 12). This effect has been well documented in several vegetable and grain crops. However, there are technologies and agricultural practices available today that can be used to counter the nutritional dilution of modern agricultural products because of the focus on higher yields.
 |
 |
There is also significant evidence that current practices that lead to agricultural crop removal of potassium are unsustainable and likely contributed to the decline in dietary potassium intake and rise in hypokalemia prevalence in the US population (Sun, 2020). Potassium concentrations in beef, pork, turkey, fruit, vegetables, cereal crops, etc., declined between 1999 and 2015, which can also be correlated to the following factors: ratios of potassium input to removal by crops, potassium in topsoil, and crop-available soil potassium. For US farms, all of these indicators declined from 1999 to 2015. Decreasing dietary potassium intake corresponds to decreasing serum potassium levels and rising hypokalemia prevalence in the US population between 1999 and 2016, with the negative trends continuing in recent years. This is another example of nutritional dilution in US agricultural products due to conventional farming’s pursuit of high yields at the expense of the nutritional content.
Regenerative agriculture practices provide an economically and environmentally sound way of achieving this goal. Their focus on soil health and its nutrient content provides a way to maximize the nutrient intake by plants and, consequently, the nutrient content in agricultural products. In addition, it provides sustainable long-term production of high-quality nutrient-rich products, which have a significant advantage over biofortified varieties of crops, whose economic and nutritional value is still to be proven due to their specific focus on one or few nutrients. Unlike them, Regenerative agriculture products provide higher nutritional content across the board, providing a balanced and reliable approach to improving overall human nutrition.
Economic Viability of Regenerative Agriculture
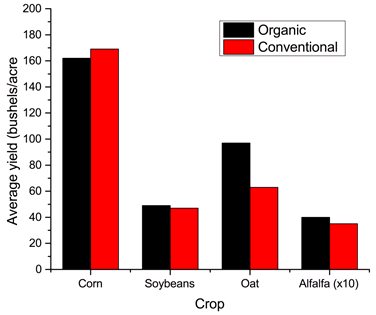
Iowa State University has been conducting a Long-Term Agroecological Research (LTAR) experiment since 1998 at the Demonstration Farm near Greenfield, Iowa. Its goal has been to provide a long-term comparison of organic and conventional crops (LTAR, 2015). Figure 13. shows the average yield comparisons for different crops, indicating that organic crops are competitive in terms of yield over conventional crops.
Over the long term, organic corn yields following two years of alfalfa have been equivalent or greater than conventional corn, averaging 162 bu/acre, compared to conventional corn provided 120-145 lb/acre of synthetic nitrogen, which averaged 169 bu/acre. Organic soybean yields, averaging 49 bu/acre, have been similar to or greater than conventional soybean yields at 47 bu/acre. Organic oat 13-yr average: 97 bu/acre compared to the county average of 63 bu/acre. Organic alfalfa 13-yr average: 4 tons/acre compared to the county average of 3.5 tons/acre. Over the entire period, organic returns have averaged twice those of conventional returns. Organic corn is currently selling for $13.73/bu, and organic feed-grade soybeans are $23.35/bu. Feed-grade oats are $5.76/bu, and feed-grade wheat is $9.86/bu.
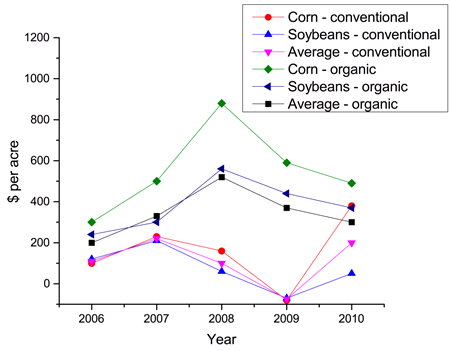
Figure 14. shows long-term economic returns from the LTAR experiment. This demonstrates that organic farms can expect higher income on similar yields due to higher prices of organic agricultural products. Regenerative agriculture farms are expected to have similar economic performance – the regenerative agriculture practices include all of the organic agriculture practices and add additional practices and synergies that reduce off-farm inputs and further reduce costs.
Several recent studies have demonstrated the economic viability and benefits of regenerative agriculture. They compared crop yields, input costs, and net returns of regenerative and conventional farms (Al‐Kaisi, 2020). There is relatively little difference in crop yields because regenerative farms produce 90-102% of the crop yield of conventional farms (He, 2019; Al‐Kaisi, 2015; Al‐Kaisi, 2016; Acar, 2017; Huang, 2011). However, the input costs of regenerative farms are around 10% lower (Al‐Kaisi, 2015; Al‐Kaisi, 2016), resulting in net returns of 90-105% of conventional farms (Al‐Kaisi, 2015; Al‐Kaisi, 2016). Crucially, these studies did not look at diversified production but at monoculture crop production, which is typical for conventional but not for regenerative farms. Although this created a good like-for-like comparison, it removed several important advantages of regenerative farming.
According to a different study, regenerative fields can generate as much as double the profit as conventional monoculture fields through increased revenue and decreased cost (LaCanne, 2018). Increased revenue comes from integrating livestock with agricultural production, where fields are used for grazing when out of season. Cost reduction is achieved by reducing or abandoning tillage and pesticide use, utilization of cover crops to suppress weeds, and reducing fertilizer usage. Although the corn yields of regenerative farms were around 29% lower, their diversified production provided around 20% higher revenue and 78% higher profits. In addition, diversified production and lower dependence on outside inputs for livestock feed make regenerative farms more resilient to natural disasters or other adverse events like market shocks and stressors.
A meta-analysis using 9,686 paired site–year comparisons representing different indicators of cropping-system performance suggests significant (P < 0.05) benefits when conservation-agriculture component practices are implemented either separately or in tandem (Jat, 2020). For example, zero tillage with residue retention had a mean yield advantage of 5.8%, a water use efficiency increase of 12.6%, an increase in a net economic return of 25.9%, and a reduction of 12–33% in global warming potential, with more-favorable responses on loamy soils and in maize–wheat systems.
Table 2. Overview of farming practices
| Control | Conventional: tillage, crop establishment, residue removal, double/triple crops |
| CA1 | Conservation: no-tillage, residue removal, double crops |
| CA2 | Conservation: no-tillage, residue retained, double crops |
| CA3 | Conservation: no-tillage, residue retained, triple crops |
Table 3. Percentage improvement over control among conservation agriculture practice systems
| CA1 | CA2 | CA3 | |
| Grain Yield | +3.0% | +5.8% | +5.5% |
| PEY | +3.0% | +5.8% | +5.5% |
| Water use efficiency | +8.3% | +12.6 | +11.6 |
| Net economic return | +20.3% | +25.9% | +40.5% |
| Methane emissions | -12.8% | -75.2% | -66.7% |
| Global Warming Potential | -12.4% | -33.5% | -31.0% |
| CO2 emissions | -7.3% | -12.6% | -11.0% |
Since conservation agriculture practices are a part of regenerative agriculture practices, this study highlights the potential of regenerative agriculture to be used to reduce greenhouse gas emissions and mitigate climate change while providing significant economic benefits to its adopters.
These studies not only demonstrate the economic viability of regenerative farming but show that it offers significant advantages over conventional monoculture farming while maintaining yields that are not significantly lower. This means that a transition to regenerative farming would not require additional agricultural land to maintain the current production levels, while the economic benefits are most evident in smallholder farms where the highest yield increases were achieved in parallel with the highest cost decrease (Al‐Kaisi, 2020).
The transition from conventional to regenerative agriculture can be a daunting prospect, especially for small farmers. It requires a considerable amount of education on the methods of regenerative agriculture, good land management, and investment in new equipment. However, as seen above, the benefits are very clear. This is why developed countries need to adopt new policies and incentives to promote regenerative agriculture and make the transition from conventional to regenerative agriculture faster and easier.
Cuba is an example of a transition from conventional industrial farming to organic and more environmentally friendly agriculture. This was done out of necessity: after the fall of the Soviet Union in 1990, Cuba found itself short on oil-based products for agriculture like fuel, fertilizers, or pesticides, as well as heavy mechanization. Therefore, Cuba underwent a comprehensive agricultural transition and reform to reduce the outside inputs of its agricultural production and effectively institutionalized agroecology (Messina, 1999; Nelson, 2009; Wright, 2012). The result was a significant decrease in the use of chemical fertilizers and pesticides, while yields recovered after the initial crisis in the early 1990s.
Today, Cuba has achieved food security (The Guardian, 2017; Riera, 2016) primarily through more environmentally friendly agricultural practices. In addition, the expansion of private farms has shown that the agricultural yields can be improved further – private farms’ share of agricultural production is higher than their share of land use, even though they are typically allocated poor-quality land (Riera, 2016). This indicates that the application of regenerative agriculture practices can significantly improve the productivity of agricultural land when access to investment, knowledge, and technology is available.
Regenerative Agriculture as the Future of EU Common Agricultural Policy
A recent study investigating the resilience of Romanian rural communities and areas and the factors contributing to it highlighted the importance of CAP funding to improve the economic resilience of Romanian farms and the importance of diversification as the means to further improve their resilience (Galluzzo, 2020):
“The study of the resilience of Romanian rural areas has found the positive role of financial subsidies allocated by national and European authorities in strengthening the resilience in Romanian rural areas. Social capital, in terms of the generation of a cooperative environment, has had a positive impact on stimulating resilience in rural territories, which have been particularly sensitive to emigration. Different level of resilience has been correlated to adequate levels of social capital and other social aspects able to catalyze the growth in rural territories corroborating outcomes investigated during economic crises in some European countries by Anthopoulou et al. (Anthopoulou 2017).”
A European Green Deal is a set of policy initiatives aimed at addressing the causes of climate change and mitigating its effects. Its primary goals are (European Commission, 2019):
- no net emissions of greenhouse gases by 2050
- economic growth decoupled from resource use
- no person and no place is left behind
It will promote clean and renewable energy, environmentally friendly practices, and methods that reduce greenhouse gas emissions. Implementation of these principles to agricultural policies is set out in The ‘From Farm to Fork’ strategy, which represents a long-term strategic document governing the future agricultural policies in the EU. This strategy has the following goals (European Commission, 2021a):
- Making 25% of EU agriculture organic by the year 2030.
- Reduce by 50% the use of pesticides by the year 2030.
- Reduce the use of Fertilizers by 20% by the year 2030.
- Reduce nutrient loss by at least 50%.
- Reduce the use of antimicrobials in agriculture and antimicrobials in aquaculture by 50% by 2030.
- Create sustainable food labeling.
- Reduce food waste by 50% by 2030.
- Dedicate to R&I related to the issue €10 billion
All of these goals and policies are complementary to regenerative agriculture practices. In particular, the focus on the reduction of off-farm chemical inputs like pesticides, fertilizer, and antimicrobials, and the reduction of nutrient loss, make regenerative agriculture the ideal framework for achieving these goals. It appears that the ‘From Farm to Fork’ strategy places regenerative agriculture and similar practices as a central tool to achieve carbon neutrality under the guise of “carbon farming”:
The Commission announced in the Farm to Fork Strategy that in 2021 it will launch a Carbon Farming initiative to promote a new green business model that rewards climate-friendly practices by land managers based on the climate benefits they provide. In addition, as announced in the Circular Economy Action Plan, the Commission will develop a regulatory framework for certifying carbon removals based on robust and transparent carbon accounting to monitor and verify the authenticity of carbon removals.
Carbon farming will provide financial incentives to the actors of the bioeconomy for climate-friendly activities resulting in carbon removals and storage, thus creating a new source of income and helping them adapt their businesses to withstand the effects of climate change.
On April 27, 2021, after a two-year study, the Commission published a technical handbook on how to set up and implement carbon farming in the EU, aimed at helping private actors and public authorities startup carbon farming initiatives.
The study explored key issues, challenges, trade-offs, and design options. It reviewed existing schemes that reward carbon sequestration or reduced emissions in five areas: peatland restoration and rewetting; agroforestry; maintaining and enhancing soil organic carbon (SOC) on mineral soils; managing SOC on grasslands; and livestock farm carbon audit.
The study concluded that result-based carbon farming could contribute significantly to the EU’s efforts to tackle climate change and provided concrete recommendations on its implementation. Pilot initiatives should be developed at the local or regional level in order to gather experience to upscale carbon farming. This will enable improving design aspects, in particular the certification of carbon removals, and expanding farmers’ knowledge and understanding of the potential benefits for them.” (European Commission, 2021b)
The focus of regenerative agriculture on soil health and maintaining or improving the carbon content in the soil makes it tailor-made for the execution of a long-term strategy like ‘From Farm to Fork.’ Some of the common regenerative agriculture practices, like agroforestry and management of soil organic carbon, are already highlighted in the announcement document. Adding to this, the proven ability of regenerative farms to operate with net-zero or net-negative greenhouse gas emissions, even when off-farm inputs are taken into consideration, makes it clear that the future of EU agricultural policy lies with regenerative agriculture.
Adoption of Regenerative Agriculture
Organic and Sustainable Wine Production
Organic wine is wine made from grapes produced by organic farming. Sustainable wine production has taken this one step further, applying the principles of sustainable farming to grape production, seeking to minimize waste and environmental impact. Biodynamic wines are produced using organic farming principles while also adding soil supplements and treating the soil as a living organism. It takes three years and four vintages to fully convert to organic production (Beverage Daily, 2021).
In 2017, according to the survey “Le bio, c’est bon pour l’emploi” conducted by the UMR Moisa (Supagro Montpellier/Inra), an organic wine farm created 1.5 times more jobs than a non-organic wine farm (Le Figaro, 2017). Another finding is that jobs in this sector are more stable. 34.6% of organic farms employ one or more permanent employees, against 21.6% in the case of non-certified farms. Similarly, 71.49% of employees are full-time, compared to 66.83% on non-organic farms (Vinatis, 2017).
Organic wine is a niche segment, accounting for around 3.6% of the global wine industry. However, this is more than 1 billion bottles annually, with a relatively rapid increase in production. Therefore, organic wine is quickly increasing its market share in the wine industry. The EU accounts for around 90% of world organic wine production. Italy, France, and Spain collectively account for 79% of organic wine production worldwide. Over the past ten years, Spain has increased the area dedicated to organic wine production by more than 520% (Beverage Daily, 2021). Italy is the world’s leading organic wine producer and is an example of how quickly organic wine production has grown: it produced 440 million bottles of organic wine in 2013, and it is estimated that the production in 2023 will be around 1 billion bottles (Market Research, 2020).
Market projections show that the organic wine market is expected to grow by close to 11% annually in the 2020-2027 period, from $7.5 billion in 2019 to $16.7 billion by 2027 (TheInsightPartners.com, 2021). By 2023, it is expected that the organic wine market will reach 1 billion bottles sold annually, which would be 100% growth over ten years, and 34% growth over five years (PulltheCork.co.uk, 2021). By comparison, the global wine market has been growing at a rate of around 2% per year and is expected to grow by 1.8% annually over the next five years by volume and 2.4% annually by value (IWSR, 2021).
Therefore, it is clear that the production of organic wine offers significant market opportunities, especially in European countries, where there is a readily available market and expertise. Combining organic wine production with regenerative agriculture practices offers a higher level of synergy: high-quality products in an environmentally friendly way that can offer additional economic benefits.
Emissions Trading and Emissions Markets
An Emissions Trading System (ETS) is an artificial market with the purpose of limiting the total emissions of greenhouse gasses (GHG) or carbon dioxide (CO2). This system allows the implementation of market solutions to GHG emission reduction, utilizing market forces to achieve emission reductions at the lowest economic cost. Although this requires extensive regulation and quality control to avoid inflated estimates of emission reductions and to achieve real long-term emission reductions, it is a good way of utilizing the free market to combat climate change. ETS are usually developed in the form of cap-and-trade systems. The emissions cap is usually determined by national governments or legislatures and has typically decreased going from one year to the next. The cap consists of emission credits, which are distributed during the initial allocation phase among the parties concerned by the regulations at the beginning of the reference period. The basic unit is typically 1 ton of CO2 equivalent (CO2e) of a greenhouse gas, which corresponds to 1 t of CO2 in its effect on global warming. There are more potent greenhouse gasses than CO2, where a smaller amount of emissions of these gasses is equated to 1 ton of CO2. Consequently, if a particular greenhouse gas is less damaging than CO2, its 1 t of CO2e will equate to more than 1-ton emission of that particular GHG.
At the end of each reference period, each participant must ‘surrender’ their allocated amount of emissions which are then canceled from their account. If a participant achieves lower emissions than the number of emission credits assigned, they have an opportunity to trade those surplus credits to the participants that failed to abide by their allocated emissions. This creates an effective mechanism for the trade of GHG emissions among participants in a free market.
The alternative form of ETS is baseline and credit. The baseline represents a reference emissions performance for participants in the market, and the credits are then allocated as the amount of difference with respect to the baseline performance level. This kind of scheme is at the base of some project-based crediting systems, like the Clean Development Mechanisms of the Kyoto Protocol and the REDD+. All currently operational national ETS are of the cap-and-trade form.
Table 4. Overview of existing or planned emission trading schemes
| Country/Region | Name | Emission Coverage (Mt CO2e / % of total emissions) | Liable Entities | Allocation | Offsets and Credits |
| EU + Iceland, Lichtenstein, Norway | EU-ETS | 1939 / 45% | >11,000 | Auctioningand freeallocation | InternationalOffsets |
| Switzerland | Swiss ETS | 5.2 / 11% | 55 | Auctioningand freeallocation | InternationalOffsets |
| 9 US States (Connecticut,Delaware, Maine,Maryland,Massachusetts,New Hampshire,New York,Rhode Island,Vermont) | RegionalGreenhouseGasInitiative(RGGI) | 89.1 / 20% | 164 | Auctioning | Domestic offsets |
| California (US.) | CaliforniaCap-andTradeProgram | 370.4 / 85% | 450 | Auctioningand freeallocation | Domestic offsets |
| Quebec (Canada) | QuebecCap-andTradeSystem | 61.1 / 85% | 132 | Auctioningand freeallocation | Domestic offsets |
| Ontario (Canada) | OntarioCap-and-TradeProgram | 142 / >80% | NA. | Freeallocation | Domestic offsets |
| New Zealand | NewZealandEmissionsTrading Stheme (NZETS) | 41.4 / 51% | 2364 | Auctioningand freeallocation | Domestic offsets |
| Republic of Korea | KoreanEmissionsTradingSystem(KETS) | 551 / 67.7% | 525 | Freeallocation | Domestic offsets |
| Mexico | Pilot (in 2020)Full (in 2022) | ~40% in pilot>67% in full program | around 300 in pilot | ||
| Germany | German National ETS | >50% | Escalating fixed price allowances | Domestic offsets | |
| United Kingdom | UK ETS | ~50% | Auctioningand freeallocation | InternationalOffsets |
European Union formed an Emissions Trading System (ETS) in 2005, which was the first large-scale emissions trading system in the world. EU ETS currently includes all 27 EU member-states and three European Economic Area-European Free Trade Association (EEA-EFTA) states: Iceland, Liechtenstein, and Norway, and it has been linked to the Swiss ETS since 2021. Phase Four of EU ETS started on January 1st, 2021, and will end on December 31st, 2030.
EU-ETS covers around 40% of the EU’s total emissions and has been judged a great success: the proposed goal for 2020, a 21% emission reduction compared to 2005, was reached in 2014. After January 1st, 2021, the UK stopped being a part of EU-ETS, replacing it with its own UK ETS system.
The operating costs of EU ETS have been significantly lower than the expected 1% GDP, and it has been suggested that the costs could be eliminated or turned into positive economic impact with improved management and effective use of revenues. EU ETS has been a major driver in the overall reduction of greenhouse gas emissions in the EU, with an overall reduction of over 8% compared to 2005 emissions for the emitters covered by the EU ETS. Currently, the EU does not allow carbon credits to be obtained under the EU ETS for carbon sinks due to uncertainties over their long-term viability and overall impact on greenhouse gasses and climate change.
Carbon Credits/Offsets
Carbon offset credit represents 1 ton of carbon dioxide equivalent (CO2e) that is removed from the environment or 1 t of CO2e of reduced emissions. Carbon credits can be generated only by enhanced carbon sequestration performance compared to a hypothetical baseline scenario. There are multiple ways to earn carbon credits: renewable energy projects, emissions capture and storage improving energy efficiency, forestry initiatives, including preserving forests, etc. There is one common thread: all of the projects claim that they would not have occurred if not for financing provided by carbon offset mechanisms. This means that their contribution to carbon sequestration is in addition to what would have happened if this carbon offset financing were not in place (the baseline). This additionality and other methodological issues are evaluated and verified by a relevant standards organization. For instance, UN Clean Development Mechanism (CDM) and Joint Implementation (JI) were created under the terms of the Kyoto Protocol, and their oversight bodies operated under the UN. On the other hand, in the voluntary markets, the role of the standards bodies is assumed by private sector operators.
The standards bodies evaluate the claims of a carbon credit project, which have to pass verification by an independent third-party auditor. After this verification and evaluation is complete, the project can be allowed to issue carbon credits in the carbon exchange. The credits originating from carbon sequestration and those from emissions reduction are typically aggregated and then sold or traded on the voluntary carbon markets. Net emitters can achieve net-zero emissions by buying and then retiring the appropriate amount of carbon credits. Retiring carbon credits removes them from the market altogether, meaning that the company that retired a carbon credit can claim to have removed 1 t of carbon dioxide equivalent from the atmosphere.
This strategy has become an increasingly popular tool among large multinational companies to reduce their carbon emissions, leading to rapid growth in the size of voluntary carbon markets. CORSIA, or the UN’s effort to mandate carbon offsetting by airlines for their emissions growth, makes it even more important to get carbon offset projects correct. CORSIA requires airlines to offset gains in their emissions after 2020, and when using the pre-COVID airline traffic increase predictions, this could result in ~4–20x multiples of demand for credits from the carbon market size today. Once implemented, CORSIA has the potential to be the biggest non-voluntary driver of carbon credit growth. By 2026 CORSIA expects to be solely responsible for ~400 MtCO2e worth of annual offsets. There will be a significant increase in credit demand in coming years if airline travel resumes to pre-pandemic levels.
However, in order to maintain carbon market stability and achieve long-term real emissions reduction, it is important to maximize the reliability of carbon credit projects. This is particularly important given the expected growth of voluntary carbon markets and the rapid increase in demand for carbon credits. Forestry carbon represents the largest category of carbon credits projects, representing the most issuances of new credits per year over the past decade. This is due to the perceived high reliability of this type of project and the potential economic benefits of using wood for industrial production without releasing sequestered carbon.
However, these projects can have varied long-term reliability: forests are susceptible to forest fires, while industrial products containing wood are eventually discarded, and the wood decomposes, which releases much of the sequestered carbon back into the atmosphere. The fact that this can occur over a long period masks that the real long-term contribution of these projects to climate change mitigation can be significantly smaller than initially evaluated. A recent study suggests that less than 20% of the credits sold in the California forest offset program correspond to additional carbon capture beyond what would be accomplished by natural processes (Marino, 2019; Haya, 2020). Therefore, rigorous verification and monitoring are required for all carbon-action projects.
Carbon Markets and Projects in Latin America and Southeast Asia
Latin America and Southeast Asia have accounted for the largest share of global carbon emissions reduction projects. In Latin America, most of the projects were conducted with the goal of preserving the Amazon rainforests, which has been partially successful. Although deforestation of the Amazon is still ongoing, these projects have been able to significantly slow down its rate to less than half from its peak in the early 2000s. This can be attributed mostly to REDD+ conservation projects and other carbon credit contributions.
However, despite this success, many forestry projects in Latin America have failed to deliver on the planned carbon sequestration set out at the beginning. There have been a myriad of issues that plagued these projects, reducing their effectiveness: lack of cooperation from the local governments and communities, insufficient funding, and carbon leakage. Nevertheless, these projects provide a baseline for future projects, allowing for a more accurate estimation of realistic carbon sequestration effects, and the local issues encountered allow future projects to be conducted in localities where forests can be protected more effectively to deliver the promised carbon credits. Otherwise, the agreed GHG emissions reductions won’t materialize.
A good example of the mixed success of forestry projects has been the Brazilian state of Acre. This has been a popular destination for forest conservation projects, with the provincial government agreeing on projects with multiple companies and organizations in the UK and Germany (ScienceDaily 2019). These projects often targeted poorer communities for project infrastructure maintenance to provide additional social benefits. California’s ETS has been accepting projects from Acre since September 2019, although the EU ETS has not done so.
Unfortunately, some of these projects have failed to deliver on the promised carbon emissions reduction, highlighting the potential drawbacks and issues that need to be addressed in future projects. An analysis by the Norwegian government of the Amazon deforestation prevention projects indicates that there are no effective follow-up mechanisms in place to prevent carbon leakage or relocation of logging operations. The local governments have failed to track and report the changes in rainforest land coverage and degradation, especially considering that logging releases some of the carbon sequestered in trees during their lifetime, reducing the real impact of these carbon credits on climate change economics.
This example highlights the inherent unreliability of forestry projects, which are highly dependent on the cooperation and effectiveness of the local government and the support of local communities. This is why forestry projects have accounted for a relatively small share of carbon credits in the international carbon markets, even though, on paper, they should have significantly more potential. Therefore, dependable mechanisms for project evaluation and monitoring are needed to make forestry projects more successful and widespread, not just regarding the size of the forest carbon sinks but also to make sure that these forests remain healthy and that the carbon remains sequestered in the trees. Right now, most of the projects are conducted in developing countries that lack the infrastructure to conduct monitoring and due diligence on these projects, although the increasing demand for carbon credits on the international markets has stimulated the players in this space to take steps in the right direction to remedy this.
Therefore, it is natural to seek methods that would represent a more reliable long-term carbon sequestration option to complement forestry projects. Agroforestry, as a component of regenerative agriculture, offers an alternative route to expanding the forest/tree coverage while providing economic benefits and lasting climate mitigation. Net negative emission regenerative farms provide the following benefits: carbon is sequestered in the farm’s produce/plants and the soil, mitigating the risk of potential unwanted release and giving a more reliable account of actually sequestered carbon and its impact on atmospheric carbon and climate change. This makes regenerative agriculture an ideal complement to tree planting activities, providing a more reliable guarantee that the investment in carbon sequestration will pay off through the mitigation of climate change.
Southeast Asia also holds significant potential for carbon sequestration and deforestation prevention projects: 15% of the world’s tropical forests are located in this region, with a deforestation rate of 1.2% per year – the highest in the world. This offers a significant economic opportunity to expand carbon markets and carbon projects in South East Asia, and it is estimated that the carbon market in this region will reach $10 billion by 2030. However, South Asian carbon markets face gross inefficiencies and significant scalability issues. There are four major challenges these carbon markets have to overcome:
- Regulatory obstacles
- Market integrity
- Increasing supply
- Infrastructure
National governments and ASEAN have yet to agree on a consistent set of policies and regulations that could help unify regulatory frameworks across the region, making it easier for foreign capital to access these markets and develop carbon projects. In addition, the quality of carbon credits from the ASEAN region varies significantly in quality, reducing buyer confidence. The main cause of this is poor onsite monitoring due to high cost, leading to a lax credit verification process and significant carbon leakage. Another major obstacle to making SE Asian carbon markets more effective has been generally poor support infrastructure for carbon markets, which is typical of immature markets. This can be addressed by standardizing margins, increasing market efficiencies, and improving access to high-quality offsets. Finally, given the rapid increase in demand for carbon credits, SE Asian carbon markets need to find a way to attract more carbon projects into the region. This is currently hampered by long project lead times (three to seven years) and a lack of private and non-governmental involvement. It is clear that the ASEAN region requires more public-private partnerships and higher involvement from non-governmental organizations.
However, there is also significant potential for carbon-action projects, either private or through public-private partnerships in developed regions of the world. The Environmental Protection Agency estimates that land use and forestry in the United States produce a carbon sink of 799 million metric tons annually (offsetting 12 percent of all US emissions), which indicates significant opportunities to expand carbon sequestration through improved agriculture, forestry, and land management (EPA, 2021). There are also significant inefficiencies in agricultural production that could be exploited to reduce its carbon footprint and achieve significant reductions in carbon emissions.
Thus, providers of credits will need to ensure quality, appropriate funding, and cooperation with local institutions to meet the growing demand for these key instruments in the fight against climate change and focus on corporate social responsibility.
Voluntary Markets
Voluntary carbon offset markets have become a vital tool for climate change mitigation by directing private capital into climate action projects that would not have been realized otherwise. In addition, voluntary carbon markets have the potential to provide a critical revenue stream to farmers and foresters who implement good land management practices.
There has been some regulatory uncertainty surrounding them lately as a result of the Paris Climate Agreement. However, this is nothing new for voluntary carbon markets since they have been dealing with regulatory uncertainty for as long as they have been around. Article 6 of the Paris Agreement determines whether countries can use voluntary carbon markets to meet their net-zero emissions targets. This creates a possibility of an international carbon market that would allow countries that exceed their targets to sell those surplus emissions to the countries that fail to meet theirs. Although this might suppress voluntary carbon markets because of the expansion of compliance markets, it is more likely that they will continue to be an important mechanism for emissions reduction.
Voluntary carbon markets are at a crucial tipping point. According to a nonprofit research group: “Demand for offsets generated through better management of forest, farms, and fields increased 264 percent over the past two years, leading to a seven-year high in the volume of voluntary carbon offsets.” (Zwick, 2019) McKinsey and The Taskforce on Scaling Voluntary Carbon Markets (TSVCM) estimate that the demand for carbon credits will increase from the current $4 billion to more than $50 billion in 2030 and more than $350 billion by 2050 (McKinsey, 2021). The surge in demand for carbon credits is attributable to voluntary initiatives from companies like airlines, oil companies, tech companies, and other large-scale businesses to achieve net carbon neutrality.
Recent research on a sample of S&P 500 and BRIC firms showed that “the positive association between firm value and voluntary carbon disclosure is stronger in developing countries. In addition, large emitters with sufficient carbon disclosure experience a less negative valuation than firms with inadequate carbon disclosure. Furthermore, a subcomponent analysis suggests that the disclosure of specific types of climate risk and opportunity is rewarded by investors and can mitigate the valuation penalty of carbon emissions.” (Jiang, 2021) This clearly shows the economic benefits of voluntary transparency regarding the carbon footprint of private enterprises and that these effects are even stronger in developing countries.
Carbon credits are typically awarded as a difference between the performance of a carbon-action project and a hypothetical baseline performance – carbon emission reduction that would occur naturally without any financing or effort put towards it. This requires significant credit verification infrastructure for onsite monitoring, which is expensive and time-consuming. However, there are alternatives that can provide a different set of criteria to evaluate carbon capture projects (Brookings Institution, 2021). The LEAF (Lowering Emissions by Accelerating Forest Finance) project provides funds to regional governments (state or province) for public programs to manage and regulate all the forests on its territory. The baseline is the total historic level of carbon in the forests across the entire area, which is easier to estimate, and less susceptible to annual fluctuations or local events.
This public-private partnership blueprint is both more cost-effective and more carbon-effective, resulting in higher quality carbon credits produced by carbon-action projects conducted in the regulated area. In addition, this also reduces carbon leakage from economic activity shifting from the carbon-action project site to the neighboring sites.
The second general principle is to scale up the size of the projects monitored – instead of monitoring individual sites (like factories or plants), the monitoring should be performed at the company level and compare the company’s emissions to the industry average. Using industry sector averages as baselines would also naturally shift emission reduction goals, as the baseline emissions would naturally decline over time as a result of an overall economy-wide effort to reduce carbon emissions by introducing more efficient technologies or carbon capture.
The third principle is to prevent or discourage the “export” of carbon emissions, where companies can move high carbon-emitting plants or factories abroad and reap the benefits of reducing carbon emissions while making absolutely no impact on global emissions.
The fourth principle is to create uniform carbon credit verification standards and procedures that can be implemented worldwide and common regulatory standards for the voluntary carbon markets. This would ensure a more uniform quality of carbon credits and make it easier to trade them on the international market. Common regulatory and verification frameworks would also allow carbon credits to be transferred between different markets, regardless of their geographical origin, and would protect the integrity of these markets.
Farmers can sequester or reduce greenhouse gas emissions and generate carbon credits through the adoption of regenerative agricultural practices that have been shown to reduce emissions and have been widely used by environmentally-minded producers. Access to carbon markets would allow them to reap additional economic benefits for implementing these practices, incentivizing their adoption. Voluntary carbon markets can also complement government conservation programs by directing private capital toward conservation practices through either private or public-private projects.
Although opportunities exist to trade offset credits and corporate demand is high, relatively few producers and landowners have taken advantage of carbon markets to date. This is mostly due to high transaction costs—including costs associated with monitoring, reporting, and verifying changes in soil and water quality. Small farms, in particular, may lack the resources and knowledge to enter the market.
Additionally, significant questions remain surrounding the long-term environmental benefits of carbon sequestration practices and the integrity of offset projects. Better tools are needed to measure soil carbon with scientific accuracy to ensure that such projects yield positive environmental outcomes. These verification challenges continue to serve as a major obstacle to the development of a more robust voluntary carbon market. However, if these challenges are overcome, it would encourage greater participation for both buyers and producers of carbon offsets and result in more extensive carbon sequestration.
Conclusion
Carbon economics is increasingly gaining importance as the world is trying to minimize the future increase in global temperatures. Paris Climate Agreement and subsequent climate agreements have set an ambitious target of limiting global warming to 1.5oC by reducing global greenhouse gas emissions to net zero by 2050. To achieve this, every possible mechanism and solution for the reduction of greenhouse gas emissions will have to be utilized. While many of these solutions require significant investment without the expectation of future economic returns beyond limiting the potential damage from climate change, there are some solutions that can provide both the reduction or elimination of greenhouse gas emissions and significant economic and environmental benefits.
The most potent of these market-based solutions are regenerative agriculture and carbon markets. Regenerative agriculture allows not only the elimination of greenhouse gas emissions caused by agricultural production, which accounts for around 25% of global emissions, but also a path towards generating negative emissions and removing carbon dioxide from the atmosphere while improving soil quality and creating a healthy environment. In addition, regenerative agriculture offers the opportunity to rehabilitate devastated land and turn it into productive agricultural land, a forest, or something else. At the same time, regenerative farms have been shown to provide better economic returns, more resilience to both economic and environmental shocks, and increased employment while minimizing the use of fossil fuel-based inputs like fuel, fertilizers, pesticides, etc. This provides a cleaner environment, reduces fossil fuel consumption, and greatly simplifies logistical chains by relying on local resources. As an added benefit, regenerative agriculture creates and maintains healthy soil and increases the concentration of nutrients in agricultural products, resulting in improved nutrition and a healthier environment for the population. These overall socio-economic improvements to the local communities set regenerative agriculture apart from other climate change solutions.
Carbon markets are a way to utilize market mechanisms to incentivize the reduction or elimination of greenhouse gas emissions at a local, regional, national, or transnational level. They provide a mechanism for enterprises to benefit from emissions reduction practices and technologies, especially those that create negative emissions and remove carbon dioxide and other greenhouse gasses from the atmosphere. While mandatory carbon markets are usually maintained by government entities and their participation in them is regulated, they typically cover only certain sectors of the economy, limiting opportunities for greenhouse gas emissions reduction. Voluntary markets can fill this void and provide additional incentives for emissions reduction while also providing additional capital to climate-conscious enterprises. Although carbon markets have been around for almost 20 years, they are not widespread, and there is much room for growth. In fact, the next decade should see rapid growth and expansion of the carbon markets as the global plans for emissions reductions are ramped up, and the overall awareness of the dangers of climate change grows in the population, which is starting to demand immediate action, not only on behalf of their governments but also on behalf of private enterprises. Studies have shown that businesses that show emissions transparency tend to be more successful in both developed Western countries and developing countries like China, India, Russia, and Brazil. This indicates that there are strong social drivers that will necessitate the implementation of market-based solutions to emissions reduction. Overall, the world is entering a phase where climate-based solutions will have to be implemented and scaled up rapidly to achieve goals set by the climate agreements. Individual countries could soon find themselves under pressure if they fall behind with their obligations. Implementation of market-based solutions like regenerative agriculture and carbon markets offer both environmental and economic benefits and promises to provide socio-economic development to underdeveloped regions. Therefore, it is clear these will represent a vital tool in the global effort to limit the global temperature increase to 1.5oC and mitigate the future consequences of climate change.
References
Acar, M., Çelik, İ. and Günal, H., 2017. Effects of long-term tillage systems on soil water content and wheat yield under Mediterranean conditions. Journal of New Theory, (17), pp.98-108.
Al‐Kaisi, M.M., Archontoulis, S.V., Kwaw‐Mensah, D. and Miguez, F., 2015. Tillage and crop rotation effects on corn agronomic response and economic return at seven Iowa locations. Agronomy Journal, 107(4), pp.1411-1424.
Al‐Kaisi, M.M., Archontoulis, S. and Kwaw‐Mensah, D., 2016. Soybean spatiotemporal yield and economic variability as affected by tillage and crop rotation. Agronomy Journal, 108(3), pp.1267-1280.
Al‐Kaisi, M.M. and Lal, R., 2020. Aligning science and policy of regenerative agriculture. Soil Science Society of America Journal, 84(6), pp.1808-1820.
Anthopoulou, T., Kaberis, N. and Petrou, M., 2017. Aspects and experiences of crisis in rural Greece. Narratives of rural resilience. Journal of Rural Studies, 52, pp.1-11.)
Badgery, W.B., Simmons, A.T., Murphy, B.W., Rawson, A., Andersson, K.O. and Lonergan, V.E., 2014. The influence of land use and management on soil carbon levels for crop-pasture systems in Central New South Wales, Australia. Agriculture, Ecosystems & Environment, 196, pp.147-157.
Beverage Daily, 2021, Organic Wine Market Continues to Grow, Available at: https://www.beveragedaily.com/Article/2019/02/08/Organic-wine-market-continues-to-grow
Brookings Institution, 2021, A framework to ensure that voluntary carbon markets will truly help combat climate change, Available at: https://www.brookings.edu/research/a-framework-to-ensure-that-voluntary-carbon-markets-will-truly-help-combat-climate-change/
CITEPA, 2022, Available at: https://www.citepa.org/en/data/
COP 26 The Glasgow Climate Pact, 2021, Available at: https://ukcop26.org/wp-content/uploads/2021/11/COP26-Presidency-Outcomes-The-Climate-Pact.pdf
Davis, D.R., 2009. Declining fruit and vegetable nutrient composition: what is the evidence?. HortScience, 44(1), pp.15-19.
Dudley, Q.M., Liska, A.J., Watson, A.K. and Erickson, G.E., 2014. Uncertainties in life cycle greenhouse gas emissions from US beef cattle. Journal of Cleaner Production, 75, pp.31-39.
Elevitch, C.R., Mazaroli, D.N. and Ragone, D., 2018. Agroforestry standards for regenerative agriculture. Sustainability, 10(9), p.3337.
Galluzzo, N., 2020. Analysis of resilience in Romanian rural farm areas by a quantitative approach. Bulgarian Journal of Agricultural Science, 26(1), pp.16-22.
Herrero, M., Havlík, P., Valin, H., Notenbaert, A., Rufino, M.C., Thornton, P.K., Blümmel, M., Weiss, F., Grace, D. and Obersteiner, M., 2013. Biomass use, production, feed efficiencies, and greenhouse gas emissions from global livestock systems. Proceedings of the National Academy of Sciences, 110(52), pp.20888-20893.
EPA, 2021, U.S. Forest Carbon Data: In Brief, Available at: https://sgp.fas.org/crs/misc/R46313.pdf
EU, 2021, COP26: EU helps deliver outcome to keep the Paris Agreement targets alive, Available at: https://ec.europa.eu/commission/presscorner/detail/de/ip_21_6021
European Commission, 2019, A European Green Deal, Striving to be the first climate-neutral continent Available at: https://ec.europa.eu/info/strategy/priorities-2019-2024/european-green-deal_en
European Commission, 2021a, Farm to Fork strategy: for a fair, healthy and environmentally-friendly food system, Available at: https://ec.europa.eu/food/horizontal-topics/farm-fork-strategy_en
European Commission, 2021b, Carbon Farming, Available at: https://ec.europa.eu/clima/eu-action/forests-and-agriculture/carbon-farming_en
FEMA, 2003, Peter Schwartz and Doug Randall, An Abrupt Climate Change Scenario and its Implications for United States National Security, Available at: https://training.fema.gov/hiedu/docs/crr/catastrophe%20readiness%20and%20response%20-%20appendix%202%20-%20abrupt%20climate%20change.pdf
Global Carbon Budget, 2021, by Pierre Friedlingstein, Matthew W. Jones, Michael O’Sullivan, Robbie M. Andrew, Dorothee C. E. Bakker, Judith Hauck, Corinne Le Quéré, Glen P. Peters, Wouter Peters, Julia Pongratz, Stephen Sitch, Josep G. Canadell, Philippe Ciais, Rob B. Jackson, Simone R. Alin, Peter Anthoni, Nicholas R. Bates, Meike Becker, Nicolas Bellouin, Laurent Bopp, Thi T. T. Chau, Frédéric Chevallier, Louise P. Chini, Margot Cronin, Kim I. Currie, Bertrand Decharme, Laique Djeutchouang, Xinyu Dou, Wiley Evans, Richard A. Feely, Liang Feng, Thomas Gasser, Dennis Gilfillan, Thanos Gkritzalis, Giacomo Grassi, Luke Gregor, Nicolas Gruber, Özgür Gürses, Ian Harris, Richard A. Houghton, George C. Hurtt, Yosuke Iida, Tatiana Ilyina, Ingrid T. Luijkx, Atul K. Jain, Steve D. Jones, Etsushi Kato, Daniel Kennedy, Kees Klein Goldewijk, Jürgen Knauer, Jan Ivar Korsbakken, Arne Körtzinger, Peter Landschützer, Siv K. Lauvset, Nathalie Lefèvre, Sebastian Lienert, Junjie Liu, Gregg Marland, Patrick C. McGuire, Joe R. Melton, David R. Munro, Julia E. M. S. Nabel, Shin-Ichiro Nakaoka, Yosuke Niwa, Tsuneo Ono, Denis Pierrot, Benjamin Poulter, Gregor Rehder, Laure Resplandy, Eddy Robertson, Christian Rödenbeck, Thais M. Rosan, Jörg Schwinger, Clemens Schwingshackl, Roland Séférian, Adrienne J. Sutton, Colm Sweeney, Toste Tanhua, Pieter P. Tans, Hanqin Tian, Bronte Tilbrook, Francesco Tubiello, Guido van der Werf, Nicolas Vuichard, Chisato Wada, Rik Wanninkhof, Andrew Watson, David Willis, Andrew J. Wiltshire, Wenping Yuan, Chao Yue, Xu Yue, Sönke Zaehle, and Jiye Zeng (2021), Earth System Science Data, DOI: 10.5194/essd-2021-386. Preprint
Goh, K.M., 2004. Carbon sequestration and stabilization in soils: Implications for soil productivity and climate change. Soil Science and Plant Nutrition, 50(4), pp.467-476.
Gosnell, H., Charnley, S. and Stanley, P., 2020. Climate change mitigation as a co-benefit of regenerative ranching: insights from Australia and the United States. Interface focus, 10(5), p.20200027.
Hansen, J., P. Kharecha, M. Sato, V. Masson-Delmotte, F. Ackerman, D.J. Beerling, P.J. Hearty, O. Hoegh-Guldberg, S.-L. Hsu, C. Parmesan, J. Rockstrom, E.J. Rohling, J. Sachs, P. Smith, K. Steffen, L. Van Susteren, K. von Schuckmann, and J.C. Zachos. 2013. Assessing “Dangerous Climate Change”: Required Reduction of Carbon Emissions to Protect Young People, Future Generations and Nature (JA Añel, Ed.). PLoS ONE 8(12): e81648
Haya, B., Cullenward, D., Strong, A.L., Grubert, E., Heilmayr, R., Sivas, D.A. and Wara, M., 2020. Managing uncertainty in carbon offsets: insights from California’s standardized approach. Climate Policy, 20(9), pp.1112-1126..
Henneman, C., Seavy, N.E. and Gardali, T., 2014. Restoring native perennial grasses by changing grazing practices in central coastal California. Ecological Restoration, 32(4), pp.352-354.
Huang, M., Zou, Y., Feng, Y., Cheng, Z., Mo, Y., Ibrahim, M., Xia, B. and Jiang, P., 2011. No-tillage and direct seeding for super hybrid rice production in rice–oilseed rape cropping system. European Journal of Agronomy, 34(4), pp.278-286.
IWSR, 2021, Global wine trends to watch in 2021, Available at: https://www.theiwsr.com/global-wine-trends-to-watch-in-2021/
Jat, M.L., Chakraborty, D., Ladha, J.K., Rana, D.S., Gathala, M.K., McDonald, A. and Gerard, B., 2020. Conservation agriculture for sustainable intensification in South Asia. Nature Sustainability, 3(4), pp.336-343.
Jiang, Y., Luo, L., Xu, J. and Shao, X., 2021. The value relevance of corporate voluntary carbon disclosure: Evidence from the United States and BRIC countries. Journal of Contemporary Accounting & Economics, 17(3), p.100279.
Kane, D. and Solutions, L.L.C., 2015. Carbon sequestration potential on agricultural lands: a review of current science and available practices. National Sustainable Agriculture Coalition Breakthrough Strategies and Solutions, LLC, pp.1-35.
Kell, D.B. 2011. Breeding crop plants with deep roots: their role in sustainable carbon, nutrient and water sequestration. Ann. Bot. 108(3): 407–418.
Kell, D.B. 2012. Large-scale sequestration of atmospheric carbon via plant roots in natural and agricultural ecosystems: Why and how. Philos. Trans. R. Soc. B Biol. Sci. 367(1595): 1589–1597.
Knapp, S. and van der Heijden, M.G., 2018. A global meta-analysis of yield stability in organic and conservation agriculture. Nature communications, 9(1), pp.1-9.
LaCanne, C.E. and Lundgren, J.G., 2018. Regenerative agriculture: merging farming and natural resource conservation profitably. PeerJ, 6, p.e4428.
Lal, R., 2004a. Soil carbon sequestration impacts on global climate change and food security. Science, 304(5677), pp.1623-1627
Lal, R., 2004b. Carbon emission from farm operations. Environment international, 30(7), pp.981-990.
Le Figaro, 2017, Le vin bio est bon pour l’emploi, selon une étude présentée au salon du bio à Marseille, Available at: https://avis-vin.lefigaro.fr/economie-du-vin/o129801-le-vin-bio-est-bon-pour-l-emploi-selon-une-etude-presentee-au-salon-du-bio-a-marseille
LTAR, 2015, Long-Term Agroecological Research (LTAR), August 2015 report from ongoing research, Available at: https://www.leopold.iastate.edu/files/frontpage/2015-NK-Field-Day-Research.pdf
Marino, B.D., Mincheva, M. and Doucett, A., 2019. California air resources board forest carbon protocol invalidates offsets. PeerJ, 7, p.e7606.
Market Research, 2020, Global Organic Wine Market – 2021-2028, Available at: https://www.marketresearch.com/DataM-Intelligence-4Market-Research-LLP-v4207/Global-Organic-Wine-14782635/
Martínez, I., Chervet, A., Weisskopf, P., Sturny, W.G., Etana, A., Stettler, M., Forkman, J. and Keller, T., 2016. Two decades of no-till in the Oberacker long-term field experiment: Part I. Crop yield, soil organic carbon and nutrient distribution in the soil profile. Soil and Tillage Research, 163, pp.141-151.
McDermot, C. and Elavarthi, S., 2014. Rangelands as carbon sinks to mitigate climate change: a review. Journal of Earth Science & Climatic Change, 5(8).
McKinsey, 2021, A blueprint for scaling voluntary carbon markets to meet the climate challenge, Available at: https://www.mckinsey.com/business-functions/sustainability/our-insights/a-blueprint-for-scaling-voluntary-carbon-markets-to-meet-the-climate-challenge
Messina Jr, W.A., 1999. Agricultural reform in Cuba: Implications for agricultural production, markets and trade. Cuba in Transition, 9, pp.433-442.
Nature, 2021, The broken $100-billion promise of climate finance — and how to fix it, Available at: https://www.nature.com/articles/d41586-021-02846-3
Nelson, E., Scott, S., Cukier, J. and Galán, Á.L., 2009. Institutionalizing agroecology: successes and challenges in Cuba. Agriculture and Human Values, 26(3), pp.233-243.
Newton, A.C., Guy, D.C., Bengough, A.G., Gordon, D.C., McKenzie, B.M., Sun, B., Valentine, T.A. and Hallett, P.D., 2012. Soil tillage effects on the efficacy of cultivars and their mixtures in winter barley. Field Crops Research, 128, pp.91-100.
Paustian, K., Chenu, C., Conant, R., Cotrufo, F., Lal, R., Smith, P. and Soussana, J.F., 2020. Climate mitigation potential of regenerative agriculture is significant. Available at:
Climate+Mitigation+Potential+of+Regenerative+Ag+is+Significant+-+Response+to+WRI.pdf
Picasso, V.D., Modernel, P.D., Becoña, G., Salvo, L., Gutiérrez, L. and Astigarraga, L., 2014. Sustainability of meat production beyond carbon footprint: a synthesis of case studies from grazing systems in Uruguay. Meat science, 98(3), pp.346-354.
PulltheCork.co.uk, 2021, Where is the Organic Wine Market Heading?, Available at: https://www.pullthecork.co.uk/where-is-the-organic-wine-market-heading-in-2020-and-beyond/
Riera, O. and Swinnen, J., 2016. Cuba’s Agricultural Transition and Food Security in a Global Perspective. Applied Economic Perspectives and Policy, 38(3), pp.413-448.
Rotz, C.A., Asem-Hiablie, S., Place, S. and Thoma, G., 2019. Environmental footprints of beef cattle production in the United States. Agricultural systems, 169, pp.1-13.
Schrama, M., De Haan, J.J., Kroonen, M., Verstegen, H. and Van der Putten, W.H., 2018. Crop yield gap and stability in organic and conventional farming systems. Agriculture, ecosystems & environment, 256, pp.123-130.
Science Daily, 2019, The carbon offset market: Leveraging forest carbon’s value in the Brazilian Amazon, Available at: https://www.sciencedaily.com/releases/2019/04/190405170454.htm
Sir John Crawford Memorial Address, 2018, Available at: https://www.crawfordfund.org/news/news-the-2018-sir-john-crawford-memorial-address-august-2018/
Sun, H. and Weaver, C.M., 2020. Rise in potassium deficiency in the US population linked to agriculture practices and dietary potassium deficits. Journal of Agricultural and Food Chemistry, 68(40), pp.11121-11127.
Teague, W.R., Apfelbaum, S., Lal, R., Kreuter, U.P., Rowntree, J., Davies, C.A., Conser, R., Rasmussen, M., Hatfield, J., Wang, T. and Wang, F., 2016. The role of ruminants in reducing agriculture’s carbon footprint in North America. Journal of Soil and Water Conservation, 71(2), pp.156-164.
The Guardian, 2017, Organic or starve: can Cuba’s new farming model provide food security? Available at: https://www.theguardian.com/environment/2017/oct/28/organic-or-starve-can-cubas-new-farming-model-provide-food-security
TheInsightPartners.com, 2021, Available at: https://www.globenewswire.com/en/news-release/2021/05/10/2226509/0/en/Organic-Wine-Market-Growth-Sturdy-at-10-7-CAGR-to-Outstrip-16-647-81-Million-by-2027-COVID-19-Impact-and-Global-Analysis-by-TheInsightPartners-com.html
Van der Knijff, J.M., Jones, R.J.A. and Montanarella, L., 2000. Soil erosion risk: assessment in Europe. European Soil Data Centre. Available at: https://esdac.jrc.ec.europa.eu/ESDB_Archive/pesera/pesera_cd/pdf/ereurnew2.pdf
Vinatis, 2017, Filière vins bio en 2017 – infographie, Available at: https://www.vinatis.com/blog-vin-bio-infographie-bilan-2016
Wittwer, R.A., Dorn, B., Jossi, W. and van der Heijden, M.G., 2017. Cover crops support ecological intensification of arable cropping systems. Scientific Reports, 7(1), pp.1-12.
Wright, J., 2012. Sustainable agriculture and food security in an era of oil scarcity: lessons from Cuba. Routledge.
Xu, S., Jagadamma, S. and Rowntree, J., 2018. Response of grazing land soil health to management strategies: a summary review. Sustainability, 10(12), p.4769.
Yang, Y., Tilman, D., Furey, G. and Lehman, C., 2019. Soil carbon sequestration accelerated by restoration of grassland biodiversity. Nature communications, 10(1), pp.1-7.Zwick, S. 2019, Voluntary Carbon Volume Hits Seven Year High on Demand for Natural Climate Solutions, Available at: https://www.ecosystemmarketplace.com/articles/voluntary-carbon-volume-hits-seven-year-high-on-demand-for-natural-climate-solutions/
Appendix
Table A1. Overview of global greenhouse gas emissions in tons of CO2 for each country in 2016
| Rank | Country | Emissions per capita | Total Emissions |
| 1 | China | 7.38 | 10432751400 |
| 2 | United States | 15.52 | 5011686600 |
| 3 | India | 1.91 | 2533638100 |
| 4 | Russia | 11.44 | 1661899300 |
| 5 | Japan | 9.7 | 1239592060 |
| 6 | Germany | 9.44 | 775752190 |
| 7 | Canada | 18.58 | 675918610 |
| 8 | Iran | 8.08 | 642560030 |
| 9 | South Korea | 11.85 | 604043830 |
| 10 | Indonesia | 2.03 | 530035650 |
| 11 | Saudi Arabia | 15.94 | 517079407 |
| 12 | Brazil | 2.25 | 462994920 |
| 13 | Mexico | 3.58 | 441412750 |
| 14 | Australia | 17.1 | 414988700 |
| 15 | South Africa | 6.95 | 390557850 |
| 16 | Turkey | 4.61 | 368122740 |
| 17 | United Kingdom | 5.55 | 367860350 |
| 18 | Italy | 5.9 | 358139550 |
| 19 | France | 5.13 | 331533320 |
| 20 | Poland | 7.81 | 296659670 |
| 21 | Taiwan | 11.72 | 276724868 |
| 22 | Thailand | 3.93 | 271040160 |
| 23 | Malaysia | 8.68 | 266251542 |
| 24 | Spain | 5.4 | 251892320 |
| 25 | Ukraine | 5.22 | 233220080 |
| 26 | Kazakhstan | 13.01 | 231919540 |
| 27 | Egypt | 2.32 | 219377350 |
| 28 | United Arab Emirates | 23.37 | 218788684 |
| 29 | Vietnam | 2.2 | 206042140 |
| 30 | Argentina | 4.61 | 200708270 |
| 31 | Pakistan | 0.87 | 178013820 |
| 32 | Venezuela | 5.89 | 175884256 |
| 33 | Netherlands | 9.62 | 163419285 |
| 34 | Iraq | 4.44 | 162646160 |
| 35 | Algeria | 3.85 | 156220560 |
| 36 | Philippines | 1.22 | 126922662 |
| 37 | Czech Republic (Czechia) | 10.53 | 111825428 |
| 38 | Uzbekistan | 3.48 | 109347340 |
| 39 | Kuwait | 25.65 | 101492225 |
| 40 | Qatar | 37.29 | 98990085 |
| 41 | Belgium | 8.34 | 94722813 |
| 42 | Oman | 19.61 | 87835773 |
| 43 | Nigeria | 0.44 | 82634214 |
| 44 | Chile | 4.46 | 81258525 |
| 45 | Turkmenistan | 14 | 79279216 |
| 46 | Romania | 3.98 | 78770824 |
| 47 | Colombia | 1.61 | 77667594 |
| 48 | Bangladesh | 0.47 | 74476230 |
| 49 | Austria | 8.43 | 73764112 |
| 50 | Greece | 6.39 | 67840662 |
| 51 | Israel | 8.04 | 65201588 |
| 52 | Belarus | 6.63 | 62655669 |
| 53 | North Korea | 2.32 | 58708734 |
| 54 | Morocco | 1.64 | 57694464 |
| 55 | Peru | 1.87 | 57692879 |
| 56 | Libya | 8.12 | 52696075 |
| 57 | Finland | 9.31 | 51183960 |
| 58 | Hungary | 5.23 | 51018899 |
| 59 | Bulgaria | 7.11 | 50872910 |
| 60 | Portugal | 4.86 | 50142844 |
| 61 | Singapore | 8.56 | 48381759 |
| 62 | Hong Kong | 6.5 | 47066386 |
| 63 | Sweden | 4.54 | 44694415 |
| 64 | Norway | 8.28 | 43456012 |
| 65 | Serbia | 4.65 | 41168059 |
| 66 | Ecuador | 2.43 | 40065690 |
| 67 | Switzerland | 4.73 | 39666930 |
| 68 | Ireland | 8.32 | 39086565 |
| 69 | Syria | 2.18 | 38054696 |
| 70 | Denmark | 6.65 | 38007645 |
| 71 | Slovakia | 6.77 | 36817242 |
| 72 | Trinidad and Tobago | 25.39 | 34974263 |
| 73 | Azerbaijan | 3.45 | 33614235 |
| 74 | New Zealand | 7.14 | 33276202 |
| 75 | Angola | 1.06 | 30566933 |
| 76 | Cuba | 2.68 | 30389116 |
| 77 | Tunisia | 2.6 | 29395965 |
| 78 | Bosnia and Herzegovina | 7.58 | 25674120 |
| 79 | Yemen | 0.94 | 25647990 |
| 80 | Bahrain | 17.15 | 24458384 |
| 81 | Dominican Republic | 2.26 | 23466740 |
| 82 | Jordan | 2.38 | 22772370 |
| 83 | Estonia | 17.02 | 22402414 |
| 84 | Lebanon | 3.26 | 21863288 |
| 85 | Bolivia | 1.76 | 19463728 |
| 86 | Croatia | 4.61 | 19408194 |
| 87 | Mongolia | 6.08 | 18574260 |
| 88 | Guatemala | 1.12 | 18539316 |
| 89 | Sri Lanka | 0.88 | 18454691 |
| 90 | Myanmar | 0.31 | 16701776 |
| 91 | Kenya | 0.33 | 16334919 |
| 92 | Montenegro | 25.9 | 16249039 |
| 93 | Slovenia | 7.1 | 14722601 |
| 94 | Ghana | 0.51 | 14469986 |
| 95 | Lithuania | 4.74 | 13685264 |
| 96 | Sudan | 0.33 | 13294106 |
| 97 | Panama | 2.87 | 11599764 |
| 98 | Ethiopia | 0.1 | 10438855 |
| 99 | Luxembourg | 17.51 | 10144632 |
| 100 | Zimbabwe | 0.72 | 10062628 |
| 101 | Côte d’Ivoire | 0.42 | 10056492 |
| 102 | Afghanistan | 0.28 | 9900004 |
| 103 | Tanzania | 0.18 | 9731560 |
| 104 | Cameroon | 0.4 | 9454331 |
| 105 | Honduras | 1.01 | 9320279 |
| 106 | Papua New Guinea | 1.1 | 9086988 |
| 107 | Jamaica | 3.08 | 8946575 |
| 108 | North Macedonia | 4.28 | 8896732 |
| 109 | Georgia | 2.14 | 8610414 |
| 110 | Costa Rica | 1.7 | 8328890 |
| 111 | Moldova | 2.03 | 8258774 |
| 112 | Senegal | 0.55 | 8247295 |
| 113 | Latvia | 4.13 | 8157157 |
| 114 | Nepal | 0.29 | 7833787 |
| 115 | Brunei | 18.28 | 7672127 |
| 116 | Kyrgyzstan | 1.14 | 6941784 |
| 117 | Cyprus | 5.87 | 6872427 |
| 118 | El Salvador | 1.08 | 6853766 |
| 119 | DR Congo | 0.08 | 6564773 |
| 120 | Benin | 0.6 | 6563709 |
| 121 | Uruguay | 1.9 | 6508013 |
| 122 | Cambodia | 0.41 | 6496958 |
| 123 | Botswana | 2.98 | 6438429 |
| 124 | Tajikistan | 0.7 | 6049757 |
| 125 | Paraguay | 0.89 | 5998469 |
| 126 | Mozambique | 0.21 | 5859171 |
| 127 | Gabon | 2.84 | 5694208 |
| 128 | Nicaragua | 0.84 | 5325447 |
| 129 | Congo | 1.05 | 5212302 |
| 130 | Albania | 1.8 | 5208319 |
| 131 | Uganda | 0.13 | 5009493 |
| 132 | Armenia | 1.57 | 4597845 |
| 133 | Laos | 0.66 | 4531276 |
| 134 | Bahamas | 11.65 | 4404247 |
| 135 | Zambia | 0.26 | 4230584 |
| 136 | South Sudan | 0.37 | 4038496 |
| 137 | Iceland | 11.81 | 3923884 |
| 138 | Namibia | 1.65 | 3901830 |
| 139 | Guyana | 4.22 | 3253057 |
| 140 | Mauritius | 2.53 | 3192307 |
| 141 | Macao | 5.07 | 3106518 |
| 142 | Haiti | 0.28 | 3086897 |
| 143 | Madagascar | 0.12 | 3026047 |
| 144 | Martinique | 7.21 | 2715477 |
| 145 | Mauritania | 0.62 | 2564345 |
| 146 | Guadeloupe | 6.2 | 2478038 |
| 147 | Burkina Faso | 0.13 | 2352070 |
| 148 | New Caledonia | 8.53 | 2338717 |
| 149 | Togo | 0.31 | 2321546 |
| 150 | Malta | 5.18 | 2257870 |
| 151 | Equatorial Guinea | 1.77 | 2156371 |
| 152 | Suriname | 3.81 | 2152933 |
| 153 | Niger | 0.1 | 2088475 |
| 154 | Guinea | 0.18 | 2071798 |
| 155 | Malawi | 0.11 | 1815598 |
| 156 | Fiji | 1.95 | 1703193 |
| 157 | Bhutan | 2.28 | 1682100 |
| 158 | Chad | 0.11 | 1670941 |
| 159 | Mali | 0.09 | 1606421 |
| 160 | Barbados | 5.39 | 1541447 |
| 161 | Djibouti | 1.62 | 1508851 |
| 162 | French Guiana | 5.5 | 1473719 |
| 163 | Rwanda | 0.12 | 1403087 |
| 164 | Sierra Leone | 0.17 | 1272332 |
| 165 | Somalia | 0.09 | 1268442 |
| 166 | Maldives | 2.59 | 1233015 |
| 167 | Réunion | 1.3 | 1132331 |
| 168 | Belize | 3.02 | 1114105 |
| 169 | Burundi | 0.1 | 1093618 |
| 170 | French Polynesia | 3.65 | 1003249 |
| 171 | Liberia | 0.18 | 846658 |
| 172 | Puerto Rico | 0.22 | 712758 |
| 173 | Eritrea | 0.2 | 684140 |
| 174 | Eswatini | 0.59 | 657572 |
| 175 | Bermuda | 10.09 | 639352 |
| 176 | Saint Lucia | 3.38 | 608182 |
| 177 | Gibraltar | 16.98 | 572708 |
| 178 | Grenada | 5.03 | 554848 |
| 179 | Central African Republic | 0.12 | 543229 |
| 180 | Seychelles | 5.43 | 519693 |
| 181 | Timor-Leste | 0.41 | 495687 |
| 182 | Antigua and Barbuda | 4.64 | 438763 |
| 183 | Cayman Islands | 6.49 | 406057 |
| 184 | St. Vincent & Grenadines | 3.31 | 362414 |
| 185 | Solomon Islands | 0.55 | 341748 |
| 186 | Guinea-Bissau | 0.18 | 318706 |
| 187 | Lesotho | 0.15 | 318438 |
| 188 | Aruba | 2.74 | 286871 |
| 189 | Gambia | 0.12 | 254127 |
| 190 | Tonga | 2.49 | 251375 |
| 191 | Western Sahara | 0.39 | 207592 |
| 192 | Saint Kitts & Nevis | 3.93 | 203036 |
| 193 | Dominica | 2.61 | 185767 |
| 194 | Samoa | 0.87 | 169939 |
| 195 | Vanuatu | 0.49 | 137706 |
| 196 | Comoros | 0.14 | 108422 |
| 197 | British Virgin Islands | 3.4 | 99762 |
| 198 | Cabo Verde | 0.19 | 99687 |
| 199 | Turks and Caicos | 1.79 | 65451 |
| 200 | Sao Tome & Principe | 0.28 | 56185 |
| 201 | Kiribati | 0.47 | 52818 |
| 202 | Falkland Islands | 16.59 | 48568 |
| 203 | Palau | 2.35 | 41732 |
| 204 | Cook Islands | 2.13 | 37354 |
| 205 | Anguilla | 2.1 | 30262 |
| 206 | Saint Helena | 2.2 | 13128 |
| 207 | Saint Pierre & Miquelon | 1.49 | 8842 |
| 208 | Faeroe Islands | 0.04 | 1953 |
| 209 | Greenland | 0.03 | 1530 |
What is the role of economics in climate change?
Economics plays a crucial role in addressing climate change by evaluating the costs and benefits of different actions to reduce carbon emissions. It helps in designing and implementing policies such as carbon taxes and emission trading systems to incentivize carbon emission reductions efficiently. Economic analysis also supports the development and deployment of low-carbon technologies, guiding investments towards sustainable practices and technologies. It assesses the economic impacts of climate change itself and the adaptation measures, providing a framework for balancing economic growth with environmental sustainability.
How can carbon taxes reduce emissions?
Carbon taxes reduce emissions by making it more expensive to emit carbon dioxide, incentivizing businesses and individuals to reduce their carbon footprint. They encourage the shift towards cleaner energy sources, energy efficiency improvements, and the adoption of low-carbon technologies. The revenue generated can be used to fund clean energy projects or offset the tax burden on other sectors. Studies show that carbon taxes have been effective in reducing emissions in various countries, demonstrating that well-designed carbon taxation can be a powerful tool for achieving emission reductions.
What are carbon credits and how do they work?
Carbon credits are permits that allow the holder to emit a certain amount of carbon dioxide or other greenhouse gases. They are a key component of market-based strategies to limit global emissions. One credit typically represents the right to emit one metric ton of carbon dioxide. Carbon credits can be traded in carbon markets, enabling companies that can reduce emissions at lower costs to sell their excess credits to those facing higher reduction costs. This system incentivizes emission reductions where they are most economical, promoting efficient and cost-effective ways to combat climate change.
How do economic policies influence carbon reduction?
Economic policies influence carbon reduction by setting the framework within which businesses and individuals operate. Policies like carbon pricing, subsidies for renewable energy, and investments in green technologies create incentives for reducing carbon emissions and fostering sustainable practices. They can direct the economy towards a more sustainable trajectory by making it financially beneficial to adopt low-carbon alternatives. Economic policies also play a crucial role in funding research and development of new technologies that can lead to further emissions reductions.
What are the economic advantages of a low-carbon economy?
A low-carbon economy offers several economic advantages, including energy security, job creation in new industries, reduced health costs from pollution, and mitigation of climate change impacts that could be costly to the economy. Transitioning to a low-carbon economy also encourages technological innovation, opening new markets and opportunities for growth in renewable energy, energy efficiency, and other green technologies. Moreover, it can lead to a more sustainable economic model, reducing reliance on finite fossil fuel resources and mitigating the risks of volatile energy prices.
How does carbon pricing work?
Carbon pricing is a market-based mechanism designed to internalize the external costs of carbon emissions, namely the societal costs of climate change such as health care costs from heat waves and droughts, and damage to property from flooding. The principle is grounded in the polluter pays concept, encouraging economic agents to reduce their carbon footprint by assigning a cost to the emission of greenhouse gases (GHGs). There are primarily two forms of carbon pricing: carbon taxes and cap-and-trade systems.
- Carbon Taxes: A direct tax is imposed on the GHG emissions of a company at a fixed rate per ton of carbon dioxide equivalent (CO2e) emitted. This approach offers simplicity and predictability, enabling firms to incorporate the cost of carbon into their operational and strategic planning.
- Cap-and-Trade Systems (Emissions Trading Systems, ETS): These establish a cap on the total level of emissions allowed and distribute or auction emissions allowances within this cap. Companies that reduce their emissions can sell their excess allowances to those that find it more costly to make reductions. This system fosters an efficient market for carbon where the price signal encourages emissions reduction where it is most economically viable.
Both mechanisms aim to shift the economic burden onto the emitter, thereby incentivizing the reduction of emissions through technological innovation or changes in practices. The efficiency of carbon pricing in driving emissions reduction is contingent upon the robustness of the price signal and the ability of the market to respond to this signal.
What are the Economic Benefits of Reducing Carbon Emissions?
Reducing carbon emissions can yield substantial economic benefits, both direct and indirect. These benefits include:
- Enhanced Public Health: By reducing pollution, there is a corresponding decrease in health issues such as asthma, respiratory diseases, and heart conditions. This reduction leads to lower healthcare costs and a healthier, more productive workforce.
- Energy Efficiency Savings: Implementing measures to reduce emissions often involves enhancing energy efficiency, which can result in significant cost savings for businesses and households through reduced energy consumption.
- Stimulation of Innovation and Job Creation: The transition towards a low-carbon economy spurs innovation in green technology and renewable energy sectors, creating new jobs and industries.
- Risk Mitigation: Lowering carbon emissions contributes to mitigating the long-term risks associated with climate change, such as extreme weather events and sea-level rise, potentially avoiding significant economic costs associated with these phenomena.
- Competitive Advantage: Early adopters of low-carbon technologies may gain a competitive advantage in the global marketplace, as demand for sustainable products and services increases.
What Is the Impact of Carbon Taxes on Businesses?
The impact of carbon taxes on businesses can vary significantly depending on the sector, the specific business model, and the tax’s design. Generally, carbon taxes impose additional costs on businesses that emit GHGs, particularly in energy-intensive industries. However, the predictability of carbon taxes allows businesses to plan and invest in emissions reduction strategies effectively. Firms can innovate to reduce their carbon footprint and thus their tax liability, potentially leading to cost savings and new market opportunities in the long term. Additionally, revenues generated from carbon taxes can be recycled back into the economy through reductions in other taxes or investments in infrastructure and technology that benefit businesses.
What Are the Advantages of Investing in Carbon Credits?
- Compliance with Regulations: For businesses subject to carbon pricing mechanisms, purchasing carbon credits can be a cost-effective way to comply with emissions reduction targets.
- Corporate Social Responsibility: Investing in carbon credits can enhance a company’s reputation by demonstrating a commitment to sustainable practices and reducing its carbon footprint.
- Market Opportunities: The carbon credit market provides financial incentives for projects that reduce emissions, such as reforestation or renewable energy projects. Investors can support sustainable development while potentially earning a return on their investment.
- Flexibility: Carbon credits offer a flexible mechanism for organizations to meet their emissions reduction goals, allowing them to support external projects that are most efficient in terms of cost and impact.
Carbon pricing plays a pivotal role in guiding economic agents towards a more sustainable path by incorporating the external costs of carbon emissions into their decision-making processes. Reducing carbon emissions offers substantial economic benefits, mitigating the impacts of climate change while fostering innovation and economic growth. While carbon taxes may present challenges to businesses, they also encourage adaptation and efficiency improvements. Investing in carbon credits represents an opportunity for businesses to align with global sustainability goals while potentially realizing financial gains.